Additional Perspective - Temperature Anomaly Record
- By:
- Edward A. Reid Jr.
- Posted On:
- Mar 28, 2017 at 7:31 AM
- Category
- Climate Change
It is generally acknowledged that human influence on global climate was minimal prior to approximately 1950. Therefore, virtually all climate change prior to 1950 is considered to have been the result of natural climate variation or a climate response to natural causes. However, the consensed climate science community asserts that climate changes since 1950 are significantly / largely / predominantly / exclusively the result of human activity.
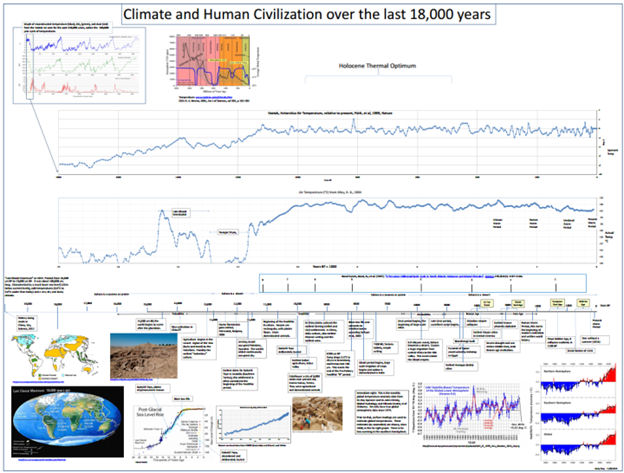
Prior to the period of the instrumental temperature record, our knowledge of global temperature changes relies on general reconstructions, based on analysis of ice cores, ocean sediments and an increasing number of additional sources. These reconstructions indicate that global temperatures have varied continuously, but over a relatively narrow range, for the past several thousand years.
The period of the global instrumental temperature record is generally agreed to begin in 1880, though the Central England Temperature (CET) record dates back to 1650. The graph below displays the global annual average temperature anomaly product prepared by the British Met Office.
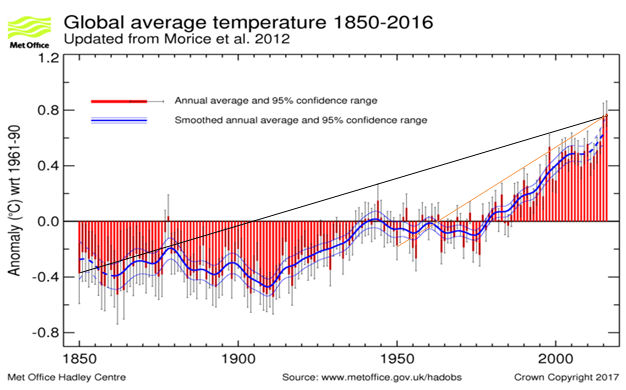
The black diagonal line on the graph illustrates the slope of the change in the global annual temperature anomaly over the entire period on the global instrumental temperature record. The orange diagonal line on the graph illustrates the slope of the change in the global annual average temperature anomaly over the period since 1950, when human influence on global average temperature is generally considered to have begun. The slope of the black line is approximately 0.07oC per decade. The slope of the orange line is approximately 0.14oC per decade. Note that, according to the Hadley Centre, 2016 is the warmest year in the instrumental temperature record; and, that 2016 is also an El Nino year.
It is not possible to separate the natural variation from any human influence in this temperature anomaly record. It is obvious that the rate of global annual temperature increase over the period since 1950 is approximately double the rate of increase over the entire period of the instrumental temperature record. However, since the increase in atmospheric CO2 concentrations over the period has been relatively constant and the use of annual anomalies renders the seasonal variation in atmospheric CO2 concentrations moot, there is obviously significant natural variation in global annual temperature over the period.
The natural fluctuations in the global temperature anomaly are easier to visualize over shorter time periods, using the monthly global temperature anomaly estimate produced by the Hadley Centre.
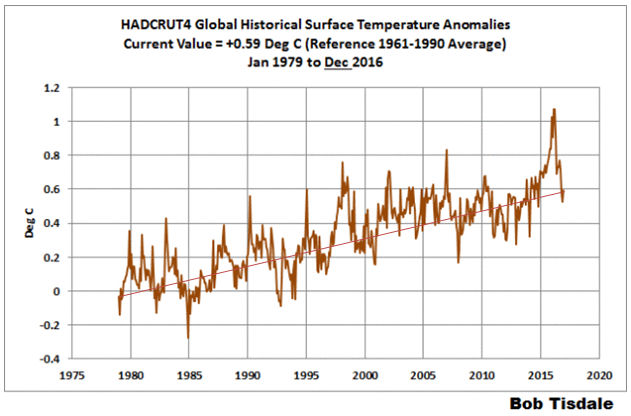
The slope of the red diagonal line on the graph, drawn from the first to the last monthly global temperature anomaly estimate, is approximately 0.16oC per decade. Again, it is not possible to separate the natural variation from any human influence in this temperature anomaly record. However, it is obvious that there is significant natural variation in the temperature anomalies. This is particularly obvious in the cases of the 1997/1998 and 2015/2016 El Nino events, both of which demonstrate natural event driven anomaly changes of 0.5 – 0.6oC.
The natural variations in the global temperature anomalies are also obvious in the satellite temperature anomaly records, as illustrated by the UAH global lower atmosphere temperature anomaly record (below). The diagonal black line on the graph connects the first and last temperature anomaly estimates in the satellite record. The slope of the line is approximately 0.16oC per decade. As in the previous examples, it is not possible to separate the natural variation from any human influence in this temperature anomaly record. However, the natural variation caused by the 1997/1998 and 2015/2016 El Nino events is very clearly visible.
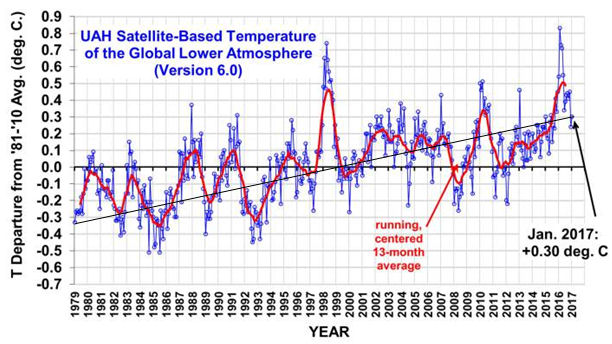
While it might be possible to attribute a relatively smooth, gradual increase in the global temperature anomaly to the relatively smooth, gradual increase in atmospheric CO2 concentrations, it is clearly not rational to attribute both the rapid increases and the rapid decreases in the anomalies around El Nino events to the gradual increase in atmospheric CO2 concentrations.
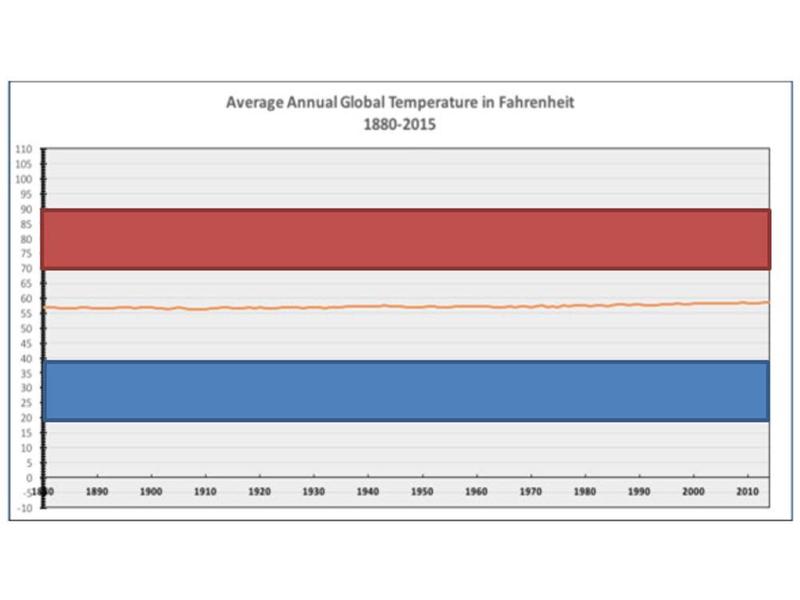
The illustrations above of the instrumental and satellite temperature anomaly records are all plotted with a “Y” axis range of 2oC or less. This truncation of the “Y” axis makes the relatively small changes in the temperature anomaly estimates far easier to see. However, the truncated “Y” axis also distorts the significance of the changes in the temperature anomalies. The graph below displays the global annual temperature anomaly over most of the instrumental temperature record, using essentially the same temperature anomaly records as those in the truncated illustrations above. The “Y” axis in this graph ranges from -10oF to +110oF (-23oC to +43oC), a representative annual temperature range for the mid-latitudes. While the increase in the global annual temperature is visible in the orange line in this graph, on close inspection, its relatively minimal significance is also far more clearly displayed.
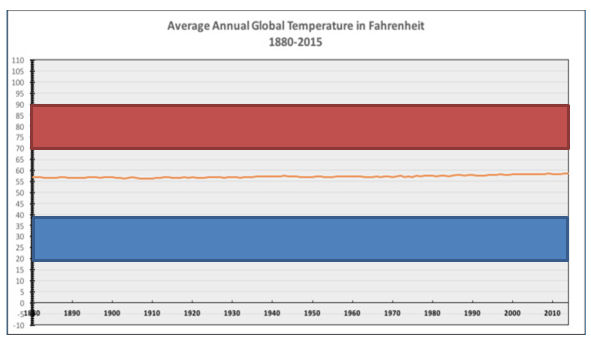
Wichita, Kansas is a typical mid-latitude city located close to the geographic center of the contiguous United States. The average temperature plotted by the orange line in the above graph is very close to the current average temperature of 57oF reported by the US National Weather Service for Wichita. The red shaded area in the graph above illustrates the typical daily average temperature range during the month of July in Wichita. The blue shaded area in the graph illustrates the typical daily average temperature range during the month of January in Wichita.
The reported increase in global annual temperature over the period of the instrumental temperature record is: approximately 8% of the daily average temperature variation experienced in Wichita throughout the year; approximately 3% of the seasonal average temperature variation; and, approximately 1.2% of the range of maximum and minimum temperature records.
The IPCC AR5 report expresses 95% confidence that more than half of the reported increase in global average temperature is the result of human influences, including gaseous and particulate emissions, land use changes and temperature “adjustments”. It is not currently possible to measure the relative effects of natural variation and human influences on global average temperature; and, it is not currently possible to measure the relative effects of the multiple potential human influences. Regardless, it is difficult to see imminent global catastrophe in the data we currently have available.