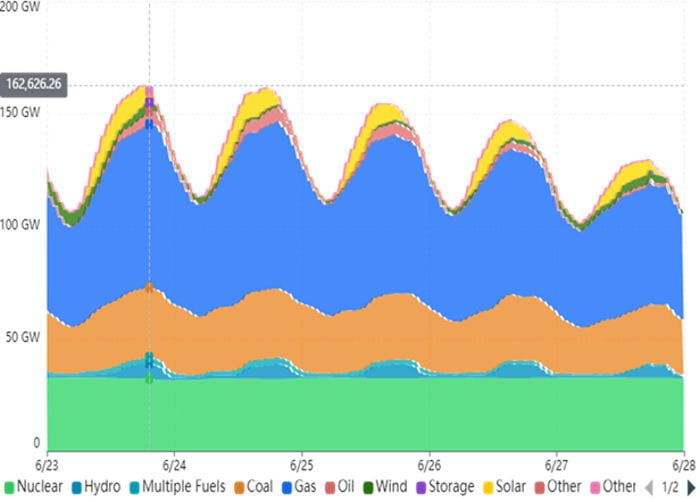
The US Middle Atlantic and Southeast states experienced five days in a heat dome from June 23-27, 2025. This extensive heat dome stressed the electric generation, transmission and distribution resources of the region, including those of the Pennsylvania / New Jersey / Maryland (PJM) Regional Transmission Operator (RTO), the largest ISO in the US. PJM issued an emergency declaration in anticipation of the effects of this heat dome on demand and consumption, requiring all generation resources to be available for full capacity operation throughout the period, as displayed on the PJM Live Dashboard.
The daily contributions of the various PJM generation assets to peak demand during the period were discussed my commentary “Five Days in a Heat Dome”. The graph below summarizes the demand and generation mix for those five days. June 23rd and 24th were the two warmest days and the generation mix for those days was nearly identical, with the exception of the wind contribution and the load following contribution of natural gas generation.

The graph below summarizes the demand and generation mix for the week of September 15th to 19th, the final week of Summer which was more like an early Fall. September 19th was the warmest day of the week. Peak demand was approximately 122 GW, or nearly 25% below the peak demand during the Heat Dome. The nuclear generation contribution remained unchanged during the week, while coal generation was reduced by approximately 50%, likely due to plant shutdowns for scheduled maintenance during the lower demand shoulder months. Natural gas combined-cycle generators provided most of the generation in load following mode, at approximately the same peak capacity as during the heat dome.

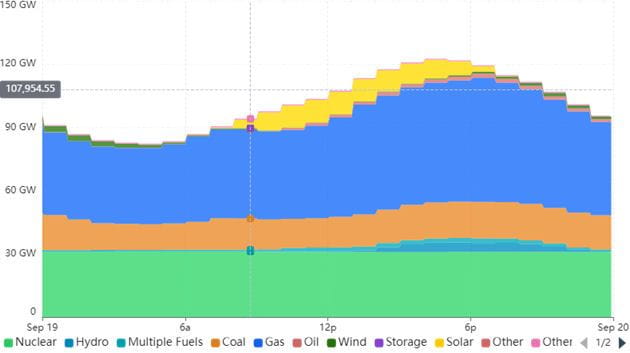
The graph below details the generating mix and generator outputs on September 19th.

The peak solar generation contribution over the periods was 10.79 GW. If that is also the rating plate capacity factor of the PJM solar generation assets, the capacity factor of the solar generation was approximately 36%, very similar to the capacity factors during the heat dome. The peak wind generation output during this period was 2.83 GW. The peak wind generation output during the heat dome was approximately 4.82 GW. If that is also the rating plate capacity of the PJM wind generation assets, the capacity factor of the wind generation on September 19th was approximately 21%.
The peak natural gas generation during both the heat dome and the recent period was approximately 60 GW. PJM had ordered “all hands on deck” during the heat dome, suggesting that all of the natural gas generating capacity was kept operating in both periods. Therefore, it is unlikely that natural gas generators could be removed from service for scheduled maintenance while coal generation capacity was also out of service for maintenance. That would suggest significant scheduling pressure for annual generator maintenance.
- ORIGINAL CONTENT
