From: Watts Up With That?
By: Charles Rotter
Date: June 23, 2020
Update: Global Man-made CO2 emissions 1965 – 2019, BP data
"Introduction
Every June BP publish their statistical review of world energy.
https://www.bp.com/en/global/corporate/energy-economics/statistical-review-of-world-energy.html
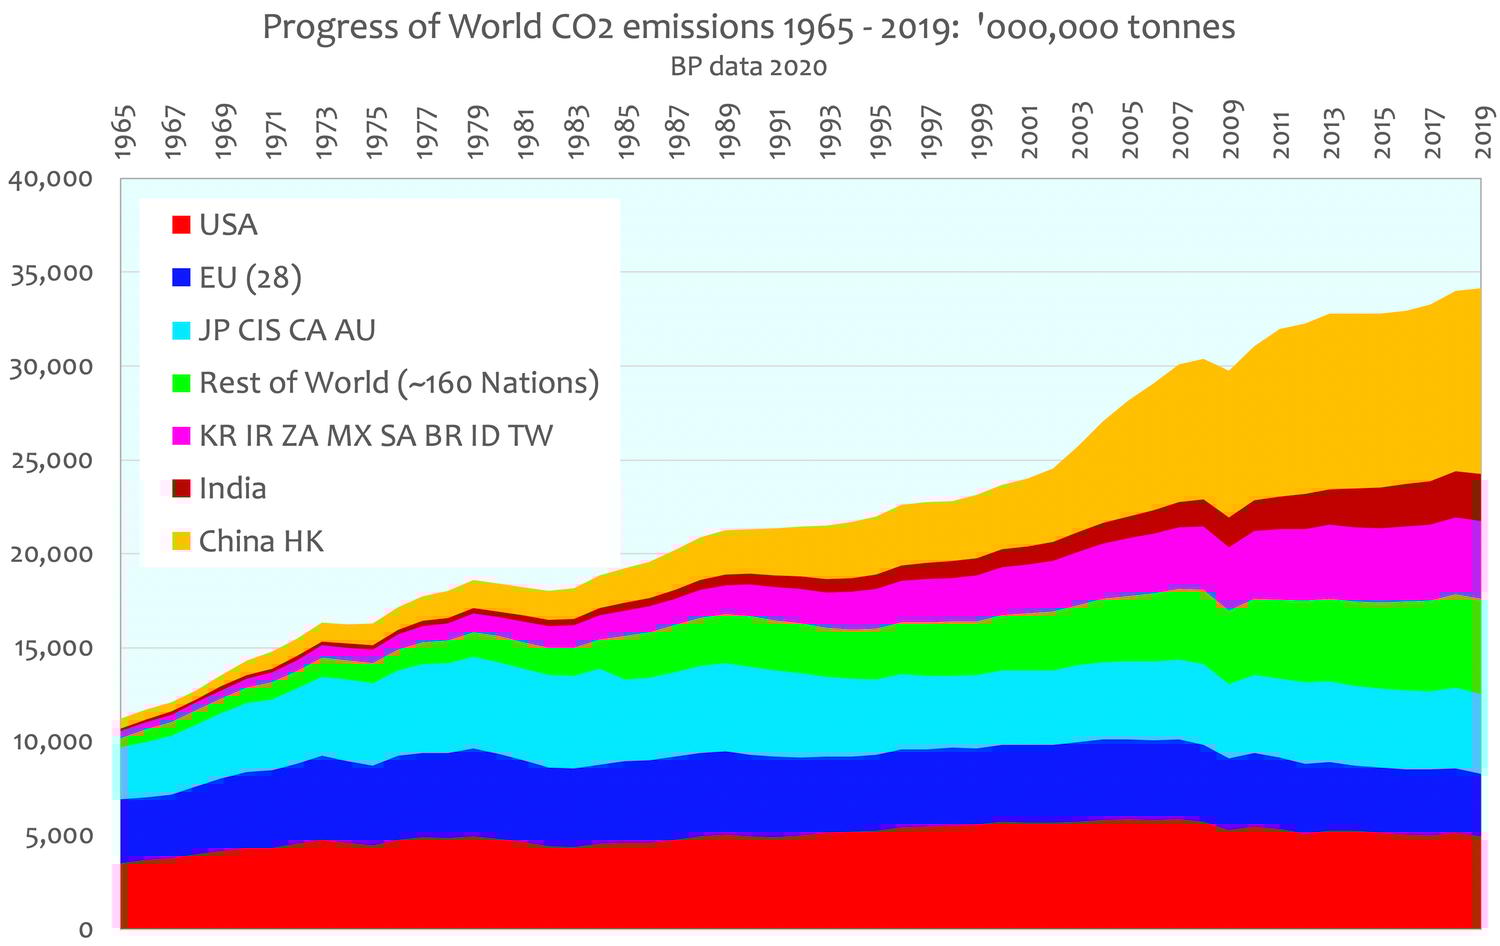
One element of their comprehensive set of spreadsheets is a table of CO2 emissions by world countries since 1965. For the purposes of this post, the CO2 emissions data provided by BP here is assumed to be correct.

That data is here and aggregated into seven Nation groups according to nominal state of development and attitudes towards controlling CO2 emissions, as follows:
- Developed
- USA
- JP CIS CA AU
- EU (28)
- Nominally Developing
- China HK
- India
- KR IR ZA MX SA BR ID TW
- Rest of World (~160 Nations)
The aggregate data of CO2 emissions growth is summarised from 1965 onwards are shown above. The marked differential between the Developed and nominally Developing worlds is shown below.
It shows:
- The virtual stabilisation of world emissions 2012 – 2019
- The continuing diminution of CO2 emissions from the Developed world from 2005 onwards
- The growing escalation of CO2 emissions from the “Developing” world, including China and India. This growth of CO2 emissions will inevitably continue and accelerate." ...
Update: Global Man-made CO2 emissions 1965 – 2019, BP data