
Wichita, Kansas is located very close to the geographic center of the contiguous United States. The annual average temperature in Wichita is 57°F, which is also the current global average near-surface temperature. Wichita has been used to provide perspective on climate change on this site previously (here), (here) and (here).
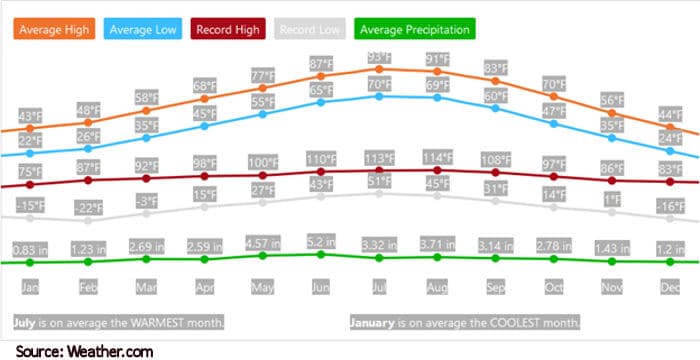
The graph below shows the average and record high and low temperatures for Wichita on a monthly basis. Note that the average diurnal temperature range is from 20 – 23°F throughout the year; and, that the average high temperature is 21°F lower than the high temperature record, while the record low temperature is 37°F lower than the average low temperature.

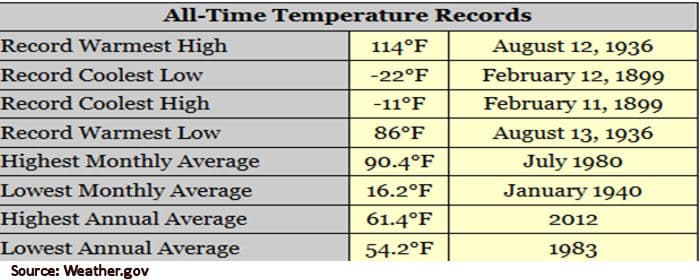
The chart below lists the all-time temperature records for Wichita and the dates on which the records occurred. Note that only the Highest Monthly Average, Highest Annual Average and Lowest Annual Average occurred in the post-1950 period, when increasing atmospheric CO2 concentrations are thought to influence global climate. Note also that the Record Warmest High and the Record Warmest Low both occurred in the 1936, during the Dust Bowl years in the US.

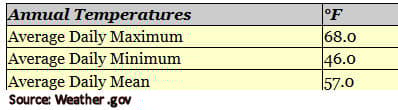
The chart below summarizes annual average temperatures for Wichita, showing the 22°F average difference between average daily high and low temperatures and the 57°F Average Daily Mean temperature.

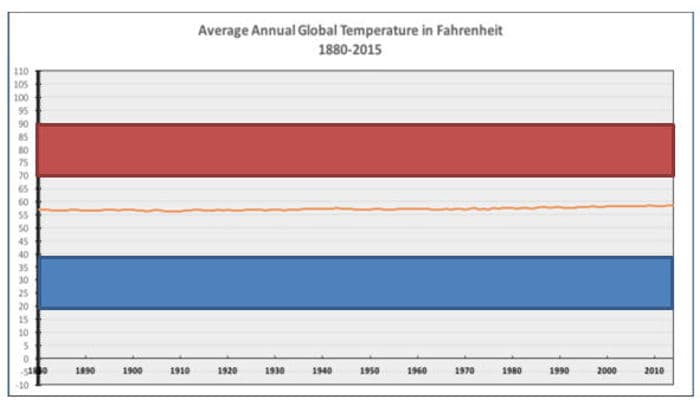
The graph below originated on the Powerline blog and has been modified here with the addition of the red and blue bands representing the average diurnal temperature ranges for the peak summer month (July, red) and peak winter month (January, blue) in Wichita. This allows comparison of the global average annual temperature change over the period from 1880 through 2015 (~1.6°F) with the average diurnal and peak seasonal temperature changes in Wichita. Note that the chart temperature range is from -10°F to +110°F, slightly lower than the -22°F to +114°F record temperature range for Wichita.

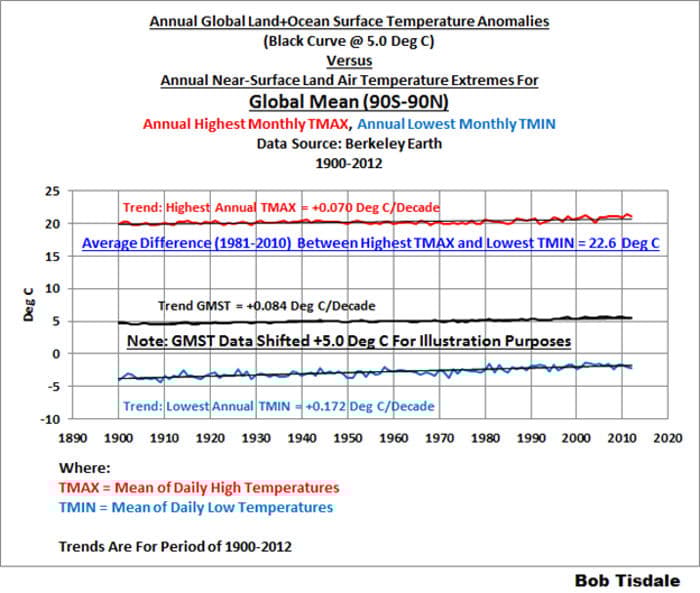
Bob Tisdale has begun a series of posts (here), (here) and (here) entitled “…it is the change in temperature compared to what we’ve been used to that matters.” The graph below, from this series of posts, compares the rate of change of global annual land plus ocean temperatures with the rate of change of the highest annual maximum near-surface temperature and the lowest annual minimum near-surface temperature for the entire globe. Note that the rate of increase of highest annual maximum temperature is approximately 40% of the rate of increase of the lowest annual minimum temperature; that is, the lowest annual minimum temperature is increasing 2.5 times as rapidly as highest annual maximum temperature. That suggests that, of the approximately 1.6°F global annual average near-surface temperature increase, only 0.6°F represents an increase in maximum summer temperatures, while the remaining 1.0°F represents an increase in the minimum winter temperatures. That seems an unlikely scenario for the “fireball earth” envisioned by the consensed climate science community.

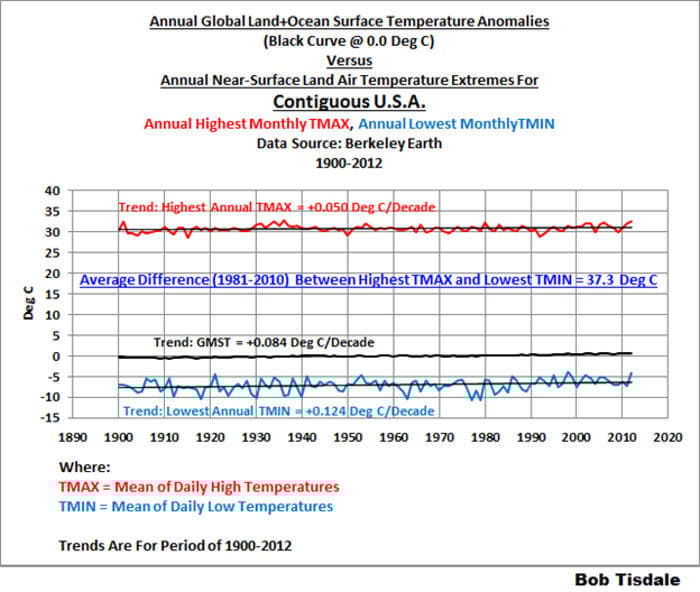
The graph below, also from this series of posts, compares the rate of change of global annual land plus ocean temperatures with the rate of change of the highest annual maximum near-surface temperature and the lowest annual minimum near-surface temperature in the contiguous US. Note again that the rate of increase of highest annual maximum temperature is approximately 40% of the rate of increase of the lowest annual minimum temperature; that is, the lowest annual minimum temperature is increasing 2.5 times as rapidly as highest annual maximum temperature. Note also that the rates of change of temperature maxima and minima are both approximately 30% lower in the US than the global rates. However, the average difference between the highest maximum and the lowest minimum in the contiguous US is approximately 70% greater than the global average.

The two Tisdale graphs above also illustrate the point made in the graph of Wichita temperatures, namely that the warming which has occurred over the past 100+ years is relatively modest compared to the total range of temperatures experienced over the same period and to the range of diurnal and seasonal temperatures. The Tisdale graphs also show that the warming over the period is of lower magnitude than the annual changes in both maximum and minimum temperatures, to which the respective populations have been adapting successfully.
We are becoming far more aware of what is happening in our climate but are still challenged to understand why those changes are happening. That should be the focus of climate research.