Call or complete the form to contact us for details and to book directly with us
435-425-3414
435-691-4384
888-854-5871 (Toll-free USA)


Contact Owner

*Name
*Email
Phone
Comment
 
Skip to Primary Navigation Skip to Primary Content Skip to Footer Navigation

In the Wake of the News

Highlighted Article: “Off Target”: Bad Economics of the Climate Crusade (mitigation not supported by mainstream analysis)


From: Master Resource

By: Robert Bradley Jr.

Date: July 30, 2021


“Off Target”: Bad Economics of the Climate Crusade (mitigation not supported by mainstream analysis)


“Although advocacy of aggressive climate-change policies is often draped with the mantle of science, mainstream economists who follow the scientific literature have shown that the popular 1.5°C policy target will pose costs that far exceed the benefits, and that the emission reductions flowing from strict adherence to the 1.5°C target would be worse for the world than doing nothing at all.” (Murphy and McKitrick, below)

Adaptation, not mitigation, has long been the answer of climate economics for climate policy. In fact, at lower climate sensitivity estimates, carbon dioxide (CO2) emissions are thought to be a positive externality, in the jargon of economics, not a negative requiring government correction.

A new study by Robert P. Murphy and Ross McKitrick, Off Target: The Economics Literature Does Not Support the 1.5C Climate Ceiling, explains this to professional economists and the climate intelligentia alike. Released by the Fraser Institute (Canada), their short-and-sweet study uses the peer-reviewed literature to undermine a key assumption/goal of the United Nations Climate Conference of Parties (COP26), which is set for November in Glasgow, UK." ...


“Off Target”: Bad Economics of the Climate Crusade (mitigation not supported by mainstream analysis)


Tags: Highlighted Article

Curiouser and Curiouser

Strange decisions are being made by numerous global governments which have committed under the Paris Accords to reduce CO2 emissions in an effort to limit the increase in the global average temperature anomaly to 1.5°C.

China is building numerous new coal-fired electric generating stations and plans to build numerous additional coal-fired generating stations. China is also funding construction of new coal-fired generating stations in numerous other countries in Southeast Asia, the Middle East and Africa under its “Belt and Roads’ program. These new coal-fired generating stations would be expected to have useful lives of 40-60 years, suggesting either that they will continue to operate beyond the “Net Zero by 2050” timeframe or that their operation will be discontinued before the end of their useful lives, resulting in very large deadweight losses. Operation of these new coal-fired generating stations will obviously increase annual CO2 emissions, even if they are offset, in part, by emissions reductions achieved by other nations.

Russia is proceeding with construction of the Nordstream 2 natural gas pipeline, with the support and encouragement of the Western European nations which will be its customers, rather than replacing existing fossil energy consumption with renewable sources of energy such as wind and solar.

Several nations in western Europe are proceeding with plans to discontinue operation of their existing nuclear electric generating capacity, though many of those plants have not reached the end of their useful lives and the early closings will result in massive deadweight losses. This issue has the greatest potential impact in France and Germany, which have been heavily reliant on nuclear generation.

Numerous nations are encouraging a transition from gasoline and diesel vehicles to electric vehicles, though this transition would place additional pressure on electric generating systems already struggling to deal with the impacts of increasing intermittent wind and solar generation and the loss of baseload and load following generation capacity.

The actions announced by the US might perhaps be the most curious. The US Administration has committed to Net Zero electric generation by 2035. Numerous states are requiring the closure of nuclear generators, several of which have not reached the end of their useful lives. The Administration recognizes that the transition to solar and wind generation and to electric vehicles would require vast amounts of rare earth minerals but has announced that the mining of these minerals will not occur in the US, leaving the US dependent on other nations, primarily China, for these materials. The decision not to mine in the US also reduces the opportunities for the creation of “high paying union jobs” for miners displaced from high paying union jobs in the coal mining industry.

The US Administration also intends to incentivize installation of 500,000 electric vehicle charging stations and announced that these charging stations would be installed preferentially in disadvantaged and rural areas, even though these areas are not where electric vehicles are being purchased and operated, or where their owners would likely choose to go to charge them.

The US Administration has apparently decided to adopt the approach of starving markets of fossil fuels to force adoption of electric end use appliances and equipment, assuming that renewable electric supply will grow rapidly enough to meet the increased demand and consumption.

What could possibly go wrong with that scenario?


Tags: Nuclear Power, Net Zero Emissions, Developing Nations Power

Highlighted Article: Dr Willie Soon Predicts Global Cooling, Slams Politicised Science


From: Watts Up With That

By: Eric Worrall

Date: July 28, 2021


Dr Willie Soon Predicts Global Cooling, Slams Politicised Science


"Dr. Willie Soon at his best, educating kids and adults at Camp Constitution about the politicisation of climate science, the exploitation of Greta Thunberg, failed climate predictions, the poor quality of mainstream science education, and the rise of the Technocracy, the growing risk from elitists who seek to subvert freedom by controlling ordinary people through manufactured fear." ...


Dr Willie Soon Predicts Global Cooling, Slams Politicised Science


Tags: Highlighted Article

Climate Forecasting

Climate forecasts are essentially very long range (multi-decadal) weather forecasts. They are subject to the same types of uncertainties as long range weather forecasts, except that the magnitude of the uncertainties is far greater.

Climate forecasts rely almost exclusively on climate models which are hindcast to historical weather, then used to project future weather over multi-decadal periods. Climate models are hindered by the fact that numerous weather and climate phenomena are not well understood and thus not included in the models except by parameterization. Perhaps the most important of these phenomena is the impact of clouds on the climate which function as feedbacks in the models. Unfortunately, there is fundamental disagreement regarding whether cloud feedback is positive or negative, no less the magnitude of the feedback.

The temperature projections of the current CMIP5 ensemble of climate models have diverged from both satellite and near-surface temperature observations since the time at which hindcasting was used to “tune” the models to historical temperature observations. The CMIP5 models project global temperature anomalies two to three times greater than the observed anomalies, with the exception of a single Russian model. This suggests quite clearly that while the models are modeling something, they are not modeling the real global climate. Since the CMIP5 models have not accurately forecast global temperature anomalies over the period since “tuning”, it is clear that they have not been validated and verified and thus should not be assumed to have any predictive skill.

The CMIP6 models currently available for analysis appear to project even greater future temperature anomalies than the CMIP5 models, which have already falsified themselves. It is currently unclear why the CMIP6 models do not provide projections more consistent with current observations. If current trends continue, it appears that the CMIP6 models will be run with RCP8.5 or its successor to create even scarier potential future scenarios.

Variants of the CMIP5 models are being used in efforts to attribute some portion of the damages caused by weather events such as tropical cyclones, droughts, floods and wildfires to climate change. However, these models are unvalidated and unverified, so there is no reason to believe that the attributions they calculate have any credibility. Since the CMIP6 models appear to project even greater deviation from observations than the falsified CMIP5 models, there appears to be even less reason to assign any credibility to any attributions they calculate.

The forecasts of “climate crisis”, “climate emergency” and “existential threat” are based on scary scenarios produced by the CMIP5 climate models, run using RCP8.5. Since RCP8.5 has been demonstrated to be extremely unlikely, if not impossible, and the models have been progressively falsified, there appears to be no reason to assume that a “crisis” exists or impends. It appears that the CMIP6 models would support the “crisis” assertion, though they appear less credible than the falsified CMIP5 models.

The “climate crisis” appears to be a political construct designed to scare the citizenry into accepting energy poverty and increased government interference.


Tags:

Highlighted Article: Testimony on the Folly of Electrifying the U.S. Transportation System


From: Climate Realism

By: Tim Benson

Date: July 26, 2021


Testimony on the Folly of Electrifying the U.S. Transportation System


Bryce Congressional Testimony Details Economic, Societal, National Security Hazards of Electrifying U.S. Transportation System

Testimony delivered before the House Select Committee on the Climate Crisis in June by Robert Bryce, a visiting fellow at the Foundation for Research on Equal Opportunity, raised a warning on the potential hazards of electrifying transportation and the regressive costs of continued federal subsidization of the sale of electric vehicles (EVs).

“Electrifying parts of our transportation system may result in incremental reductions in greenhouse gas emissions,” Bryce argued. “But a look at history, as well as an analysis of the supply-chain issues involved in manufacturing EVs, the resource intensity of batteries, and the increasingly fragile state of our electric grid – which is being destabilized by bad policy at the state and national levels – shows that a headlong drive to convert our transportation systems to run on ‘green’ electricity could cost taxpayers untold billions of dollars, increase greenhouse gas emissions, be bad for societal resilience, make the U.S. more dependent on commodity markets dominated by China, make us less able to respond to extreme weather events or attacks on our infrastructure, and impose regressive taxes on low and middle-income Americans in the form of higher electricity prices.” ...


Testimony on the Folly of Electrifying the U.S. Transportation System


Tags: Highlighted Article

Weather Forecasting

Weather forecasting: the prediction of the weather through application of the principles of physics, supplemented by a variety of statistical and empirical techniques., Brittanica

There are fundamentally two types of weather forecasts. Short term forecasts (1-15 days ahead) are developed largely based on observation of existing weather patterns and projections of those patterns into the future while long term forecasts (seasonal or annual) are based on historical records and measured deviation of factors believed to affect the weather from historical norms. The availability of satellite imagery combined with wind speed and direction, temperature and humidity data and experience with development of weather in the region has allowed short term forecasts to be extended out to up to 15 days. However, the forecast accuracy declines as the forecast period is extended, because there are so may factors which can alter weather patterns over time.

One critical example of short term forecast weakness is the projection of the path and intensity of tropical depressions. The development of specific tropical depressions is not predictable. The existence of a tropical depression is identified from satellite imaging. The movement of the depression is then tracked and its intensity measured.


North Atlantic Hurricane Tracking Chart 2005


There is no certainty that any specific tropical depression will develop into a tropical storm or ultimately into a tropical cyclone (hurricane or typhoon) of some intensity. Satellite monitoring of the depression is used to determine whether it has developed into a tropical storm, at which point aircraft monitoring of storm wind speed and barometric pressure documents further development and storm path and speed. Multiple computer models are then used to project future path and intensity.


Similarly, weather observations can establish that conditions are suitable for the development of severe thunderstorms and tornadoes, but the development of a specific tornado or cluster of tornadoes is not predictable. Tornado strength and direction are also not predictable, though they are closely monitored once development has occurred.

Examples of long term weather forecasts include the seasonal tropical cyclone forecasts developed annually by the National Hurricane Center. These forecasts are developed based on historical experience combined with analysis of deviation of factors such as sea surface temperature deviations from historical norms. They provide estimated ranges of number of named storms, number of hurricanes by intensity category and number of projected landfalls. However, the National Hurricane Center was not able to predict the 12 year “hurricane drought” during which no category 3 or higher hurricanes made landfall in the US, nor the recent 3 year “hurricane drought” in which no hurricanes formed in the Gulf of Mexico.

Other examples of long term weather forecasts include seasonal projections of regional temperature deviations from climatological norms, drought location and duration, winter snow cover. These forecasts are subject to frequent revisions as unpredictable events and conditions affect the anticipated weather patterns.

The accuracy of both short term and long term forecasts will continue to improve as  instrumental data and satellite observations accumulate and our understanding of our complex and chaotic atmosphere improves.


Tags: Severe Weather

Highlighted Article: Global Man-made CO2 Emissions 1965 – 2020: BP Data


From: edmhdotme

Date: June 26, 2021


Global Man-made CO2 Emissions 1965 – 2020: BP Data


"Introduction

Every summer BP publish their statistical review of world energy.

https://www.bp.com/en/global/corporate/energy-economics/statistical-review-of-world-energy.html

One element of their comprehensive set of spreadsheets is a table of CO2 emissions country by country since 1965.  For the purposes of this post, the CO2 emissions data provided by BP here is assumed to be valid.

The 2020 dataset takes begins to account for the effect of the COVID epidemic, its impact on Global economic activity and the outcome for Man-made CO2 emissions in that year.


"The progress of the proportions of CO2 emissions since 1965 is shown above, with the  Developed world now being responsible for about 35% of Man-made CO2 emissions as opposed to as much as 86% back in 1965.

The BP country by country data is aggregated here into seven Nation groups according to their nominal state of development and attitudes towards controlling CO2 emissions, as follows:" ...


Global Man-made CO2 Emissions 1965 – 2020: BP Data


Tags: Highlighted Article

Knowns and Unknowns

“There are known knowns. These are things we know that we know. There are known unknowns. That is to say, there are things that we know we don't know. But there are also unknown unknowns. There are things we don't know we don't know.”
Donald Rumsfeld

Known Knowns (Things we know we know.)

  • Earth has climates, which are aggregated to a global climate.
  • Earth’s climates have changed in the past.
  • Earth’s climates are changing now.
  • Global aggregate climate is changing now.
  • Earth has experienced glacial periods.
  • Earth has experienced interglacial periods.
  • Earth has experienced warmer and cooler periods during interglacials.
  • Earth’s average near-surface temperature is rising.
  • Earth’s sea surface temperature is rising.
  • Earth’s sea level is rising.
  • Human actions are adding CO2 and other chemicals to the atmosphere.
  • CO2 and Methane absorb and reradiate infrared energy in the atmosphere.
  • Water vapor is the primary absorber and re-radiator of infrared energy in the atmosphere.
  • Human actions are changing earth’s albedo.
  • Human cities create urban heat islands.
  • The globe is greening, largely as the result of increased atmospheric CO2.
  • Increased atmospheric CO2 makes plants grow faster and use water more efficiently.
  • Earth’s seas are absorbing more CO2 and becoming slightly less basic.
  • Earth’s oceans experience warm and cool phases. (AMO, PDO)
  • ENSO produces localized warming and cooling of the Pacific Ocean.
  • We have no comprehensive, validated and verified model of earth’s climate.
  • We have no validated and verified attribution model.


Known Unknowns (Things we know we don’t know.)

  • The factors which trigger glacial periods.
  • The factors which trigger interglacial periods.
  • The duration of interglacial periods.
  • The relative effects of those factors.
  • The factors which cause climate to change within glacial and interglacial periods.
  • The factors which determine when those climate changes occur.
  • The factors which determine the magnitude of those climate changes.
  • The factors which determine the duration of those climate changes.
  • The factors which determine whether those climate changes will be warmer or cooler.
  • The global average near-surface temperature.
  • The global average sea surface temperature.
  • The global average ocean temperature.
  • The global average near-surface temperature anomaly.
  • The global average sea surface temperature anomaly.
  • The global average rate of sea level rise.
  • The impacts of human activity on future global average near-surface temperature.
  • The impacts of human activity on future global average sea surface temperature.
  • The impacts of climate change on tropical cyclones.
  • The impacts of climate change on tornadoes.
  • The impacts of climate change on droughts.
  • The impacts of climate change on floods.
  • The sensitivity of the atmosphere to a doubling of atmospheric CO2
  • The magnitude of cloud feedback and whether it is positive or negative.
  • The Social Cost of Carbon (Dioxide).
  • The future Resource Consumption Pathway.


Unknown Unknowns (Things we don’t know we don’t know.)

  • We just do not know.


In summary, we know generally what has happened in the past and what is happening now. We do not clearly understand how and why what happened in the past happened. We do not clearly understand how and why what is happening now is happening. We do not have the validated and verified tools to comprehensively model the current atmosphere, no less to predict with confidence what will happen in the future. We have produced advanced satellite measurement tools, but have yet to resolve the differences between their measurements and our historical direct measurements.

Regardless, we continue to report with two decimal place precision numbers we do not know to one decimal place accuracy, to make future climate projections based on incomplete models and uncertain feedbacks, and to attribute weather change to climate change with unvalidated and unverified models.


Tags:

Highlighted Article: Covid And Climate: Key Failures In Policy Parallels


From: Forbes

By: Tilak Doshi

Date: July 5, 2021


Covid And Climate: Key Failures In Policy Parallels


"Just over a year ago, I wrote in these pages an article noting the remarkable similarities in government policy responses to the impacts of the global Covid-19 pandemic and to those of climate change. Developments over the past year have only served to emphasize the resilient nature of these similarities. The striking parallels in government policy to mitigate perceived “existential threats” to humanity have become even more notable. They betray a range of critical defects in policy making, from an inordinate dependence on speculative models to the lack of transparency and the ideological corruption of science, selective reporting and group think, and the suppression of sceptics. Let’s revisit some of these parallels in government policy towards the Covid pandemic and climate change.

Two Recent Events

On the Covid-19 front, the most explosive development relates to the increasing plausibility of the view that the Sars-Cov-2 virus leaked from the Wuhan Institute of Virology. This occurred after over a year of outright denials by Dr. Anthony Fauci, director of the U.S. National Institute of Allergy and Infectious Diseases (NIAID) and the chief medical advisor to the president. This was accompanied by an onslaught of supportive articles by the mainstream media and the demonization of Senator Tom Cotton as a ‘conspiracy theorist’. He was among the first to raise the likelihood about the lab-release of the corona virus from the Wuhan institute. Newly released emails from Dr. Fauci now suggest that that he may have known that the Chinese research institute was carrying out dangerous gain-of-function research." ...


Covid And Climate: Key Failures In Policy Parallels


Tags: Highlighted Article

Electric Energy Storage

The operation of the electric grid requires continuous balance between supply and demand. Electric demand fluctuates throughout the day and these fluctuations are significantly different between weekdays and weekend days. Electric powerplant outputs are adjusted as required to match demand. The recent addition of limited grid scale electric storage facilities assists the grid operators in responding to demand fluctuations. However, these storage facilities are primarily intended to assist grid operators in responding to supply fluctuations resulting from the intermittent nature of renewable energy sources such as wind and solar, whose outputs can change very rapidly.

The principal tool of grid supply management is the natural gas combined cycle powerplant, since its output can be adjusted rapidly over a broad range. However, as the percentage of renewable generation feeding the grid increases and the percentage of fossil fueled generation decreases to reduce CO2 emissions, the availability of demand-responsive fossil fuel generation to match the expected rapid changes in renewable supply would decrease.

The intended replacement for demand-responsive generation is grid-scale storage. This storage would be configured to meet short term fluctuations in renewable generator output, intermediate term reductions resulting from multi-hour periods of overcast skies or still air conditions, overnight periods of zero solar generation and even multi-day periods when either solar or wind or both are unavailable or dramatically reduced.

The ability to use grid-scale storage to supplement renewable generation is dependent upon the availability of surplus renewable generation to charge and maintain the storage batteries as well as to compensate for the losses which occur during battery charging and discharging. The capacity of the storage system is a function of the percentage of renewable generation supplying the grid, the number of days during which there might be low or non-existent renewable generation and of the capacity factor of the renewable generation fleet.

The 30 GW offshore wind generation target established by the Biden Administration for 2030 can be used to illustrate this issue. The generators to be deployed to meet this target were assumed in the previous commentary to have a 60% capacity factor. This would be achieved over a range of possible operating scenarios from 100% capacity operation 60% of the time to 60% capacity operation 100% of the time. In the case of 100% capacity operation 60% of the time, approximately 40% of the power generated would have to be stored for use during the 40% of the time the generators were not producing power. In the case of operation at 60% capacity 100% of the time, storage requirements would be reduced, with the reduction determined primarily by the demand curves of the served customers.

Onshore wind generation has a lower capacity factor, which peaks at 40-45% in the best locations and would decrease as additional generators were installed in sub-optimal locations. Solar generators have an even lower capacity factor, which peaks at approximately 30% in optimal locations. As the capacity factor of the renewable generator fleet declines, the storage capacity required to supply grid demand during periods of low or no renewable generation increases, as does the renewable generator capacity required to meet current grid demand while providing sufficient additional generation to recharge the battery storage.


Tags: Electric Power Generation, Energy Storage / Batteries

Highlighted Article: Coronavirus And Climate Change: A Tale Of Two Hysterias


From: Forbes

By: Tilak Doshi

Date: May 14, 2021


Coronavirus And Climate Change: A Tale Of Two Hysterias


"Up to a few months ago, life was normal. Well, sort of. In that pre-coronavirus normalcy, the reigning narrative was that of mankind facing assured destruction if we did not amend our wasteful – read carbon-intensive — ways. Short of a drastic curtailment in our use of fossil fuels, we would all perish in the not too distant future.

How distant depended on who one listened to. At the radical end of the spectrum — US Congresswoman Alexandria Ocasio-Cortez, teenage icon Greta Thunberg and the Extinction Rebellion folk among others — gave us a decade or less before we would face the fury of the elements, be they fires, droughts, floods, and other horrors of biblical proportions. The “moderate” position held by the mainstream climate change establishment — ranging from the key multilateral organizations such as the UN’s IPCC to the private sector with oil majors such as Shell and leading environment and social governance (“ESG”) practitioners like Larry Fink, CEO of the world’s largest hedge fund BlackRock – held that we had to reach the “net-zero” rate of carbon emissions by 2050 lest the world climate “tip over” to Armageddon.

But then, something happened along the way. Up popped a particularly contagious virus, first in its birthplace in Wuhan, China, and then spreading across the world. In a mere couple of months, the novel coronavirus began to wreak death and economic mayhem, the latter caused primarily by governments panicked into shutting down entire swathes of the economy to “flatten the curve” of infections to avoid health systems from being overwhelmed." ...


Coronavirus And Climate Change: A Tale Of Two Hysterias


Tags: Highlighted Article

Offshore Wind

We begin by reviewing the measurement unit for electric demand and consumption.

1 Terawatt = 1 trillion watts
                = 1 billion kilowatts
                = 1 million megawatts
                = 1 thousand gigawatts

1 Terawatt-hour = 1 trillion watt-hours
                       = 1 billion kilowatt-hours
                       = 1 million megawatt-hours
                       = 1 thousand gigawatt-hours

At the end of 2020, the United States had 1,117,475 MW—or about 1.12 billion kilowatts (kW)—of total utility-scale electricity generating capacity and about 27,724 MW—or nearly 0.03 billion kW—of small-scale solar photovoltaic electricity generating capacity.

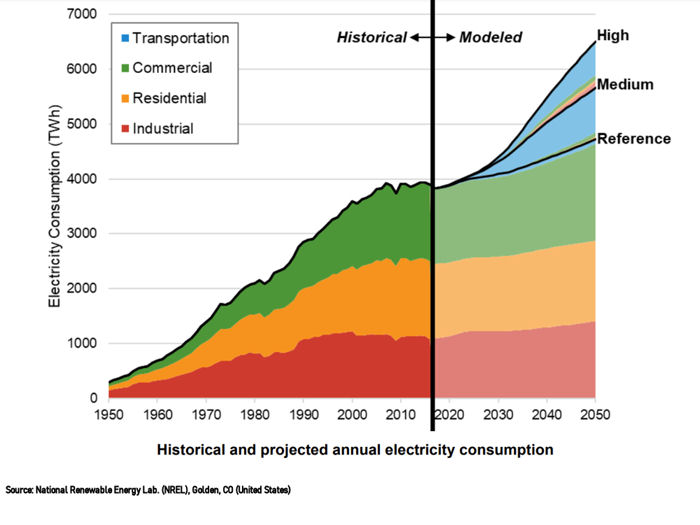
US electricity consumption in 2020 was approximately 4,000 Terawatt-hours.


Historical and projected annual electricity consumption

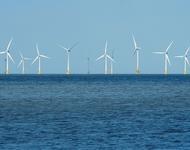
The Biden Administration has established a 30 GW target for offshore wind generating capacity by 2030. General Electric produces the Haliede-X offshore wind turbine in 12-14 MW capacities, with a reported capacity factor of ~60%. As an illustration, let us assume that the entire 30 GW of capacity consists of GE 14 MW wind turbines.


Reaching the Administration’s offshore wind capacity target would involve installation of approximately 2150 wind turbines capable of producing approximately

30 GW * 60% * 8760 hrs. = 157,680 GWh

of electric power annually, or approximately

157,680 GWh / 4,000,000 GWh = ~4%

of US 2020 electric energy consumption and approximately 3.5% of projected 2030 electric energy consumption.

The proposed new offshore wind capacity is approximately 10% greater than the currently installed utility scale wind capacity of 27.7GW, which is approximately 2.5% of total US utility scale generating capacity.
 
It is common practice, when discussing wind and solar installations, to refer to the number of homes the system would be able to power. US EIA reports that the average US household consumes 11,000 kWh of electricity per year Therefore, the Administration’s 30 GW offshore wind capacity target would be sufficient to power

157,680 GWh = 157,680,000,000kWh / 11,000 kwh/home–year = 14,334,000

homes, based on the 60% capacity factor.

The wind turbines, when operating at full capacity, would produce more electricity than the served homes would require, providing surplus electricity to be stored for use by the served homes during periods when the turbines were not operating, or were operating below rated capacity, due to wind conditions. The duration of periods when wind conditions would not support full capacity operation and the duration of periods when wind conditions were insufficient to permit the turbines to operate would determine the electricity storage capacity required to assure stable, reliable grid operation.

Storing electric energy in grid-scale batteries for later use involves the loss of ~25% of the energy delivered to the batteries from the generation source. Grid-scale battery storage is currently very expensive, and it is more expensive the longer the period of time over which the battery must store the energy. Situations in which wind conditions might be unsuitable for turbine operation over one or more days require massive and massively expensive battery installations. Battery cost will likely continue to decline, though the pace and extent of the cost reductions is not currently predictable.


Tags:

Highlighted Article: Climate Change, Extreme Weather, and Electric System Reliability


From: Climate Etc.

By: Judith Curry

Date: June 27, 2021


Climate Change, Extreme Weather, and Electric System Reliability


"I recently participated in a Technical Conference sponsored by the U.S. Federal Energy Regulatory Commission (FERC).


This was a very interesting conference. Unfortunately there is no podcast or record of the written statements submitted by the panel

The main part of my written statement is provided below

JC remarks to FERC

The remarks that follow respond to issues raised for Panels #1 and #2, in context of CFAN’s experience in dealing with extreme weather- and climate-related issues for the energy sector.

How extreme can it get?

Extreme weather events are rare, by definition. When planning for future weather extremes, several different approaches are used:

  1. recent climatology: 1-in-10 or 1-in-20 year standard
  2. 50- or 100-year return time
  3. worst cases in the historical record
  4. incremental changes to #1 – #3 associated with manmade global warming." ...


Climate Change, Extreme Weather, and Electric System Reliability


Tags: Highlighted Article

Command Push Markets

Command economy is a system where the government takes the decision regarding goods production, process, quantity, and price in a country. In this system, the government also manages even income and investments. A Communist nation like the former Soviet Union, Cuba, North Korea work according to this system.

The US federal government, the UN and environmentalist organizations are attempting to use anthropogenic climate change, which they portray as a “crisis”, “emergency” or “existential threat” as justification to change the US economy from a demand pull economy to a command push economy. There is no broad consumer demand for a major federal government or international effort to halt or reverse the mild climate change which has occurred over the past 70 years. Climate science does not support the political description of climate change as a “crisis”, etc.  Climate change is not among the top ten concerns among the US population according to ongoing polling. There is no demand pull in the US economy for the various approaches identified to address climate change, only command push.

The US Administration has rejoined the Paris Accords and then adopted a new Intended Nationally Determined Contributions (INDC) under the Accords. This INDC commits the US to reduce fossil fuel CO2 emissions by 50% from 2005 levels by 2030, achieve net zero emissions in the electricity sector by 2035 and net zero emissions throughout the economy by 2050.

The various aspects of this new INDC would require retirement and replacement of virtually all coal, oil and natural gas fueled electric power generation facilities with wind and solar generation and electric energy storage facilities by 2035. This compressed time frame would require extremely rapid expansion of both wind and solar generation and the immediate adoption of new, immature and extremely expensive storage battery technology. This would also result in the early retirement of existing, functioning fossil fueled generation assets and strand massive quantities of fossil fuel resources. The new investment requirements would include trillions of dollars of wind and solar generation facilities and tens of trillions of dollars of electricity storage facilities. These investments in the energy sector would result in dramatic increases in energy costs throughout the economy.

There is no demand pull in the US economy for wind and solar generation. Numerous federal and state programs provide financial incentives and generation preferences for wind and solar, since these incentives are required to offset the economic unattractiveness of the investments.

There are also proposals to terminate manufacturing of internal combustion engine light and medium duty vehicles by 2035 and to ban operation of such vehicles by 2050. There is little or no demand pull in the US economy for electric vehicles and massive federal and state incentives are required to support EV sales. Recent surveys have determined that many early EV adopters are trading their EVs for internal combustion engine vehicles for a variety of reasons.

Finally, several US cities have attempted to ban future installation of natural gas service to new residential and commercial buildings. There is no demand pull in the US economy for such a ban.

There is no official government estimate of the cost of achieving the new INDC, but unofficial estimates place the cost at approximately $100 trillion. There is no demand pull in the US economy for these extra investments and increased costs, thus requiring the intended command push approaches.


Tags:

Highlighted Article: A global context for Man-made Climate Concerns


From: edmhdotme

Date: June 26, 2021


A global context for Man-made Climate Concerns


"Summary

Earth has existed for some 4,600 million years.  This condensed history sets the current concerns about the level of atmospheric CO2 and the possible recent impact of extra Man-made CO2 affecting global temperature in a rational context.


CO2 in the atmosphere

To understand the context of current concerns about the increase of CO2 in the atmosphere from the Man-made activities, it is useful to review the long-term history of the Earth’s atmosphere.


Composition of Earth's atmosphere


  • as far as the development of life on Earth was concerned the first 4,000 million years were comparatively uneventful.  It took evolution all that time to make any advances beyond single cell/algal organisms.
  • in those earlier times, ~3,300 million years ago CO2 had reached its maximum level of about 35%, 350,000 ppmv:  atmospheric CO2 concentration has progressively diminished ever since.
  • it was only when photosynthesis took hold, that the level of atmospheric Oxygen could rise to its current level of ~22% of the atmosphere.
  • over the same period CO2 concentrations diminished as plant photosynthesis used the sun’s energy to convert atmospheric CO2 to sugars and thus to generate all other types of organic molecules associated with life.
  • CO2 has progressively disappeared from the atmosphere both being absorbed by the Oceans to be sequestered by Ocean life as limestones or later converted into fossil fuels from luxuriant Plant growth.
  • as a result atmospheric CO2 has reduced by some thousand fold from its high point of 35%, 350,000ppmv to arrive at the current levels around 400+ppmv." ...


A global context for Man-made Climate Concerns


Tags: Highlighted Article
Search Older Blog Posts