
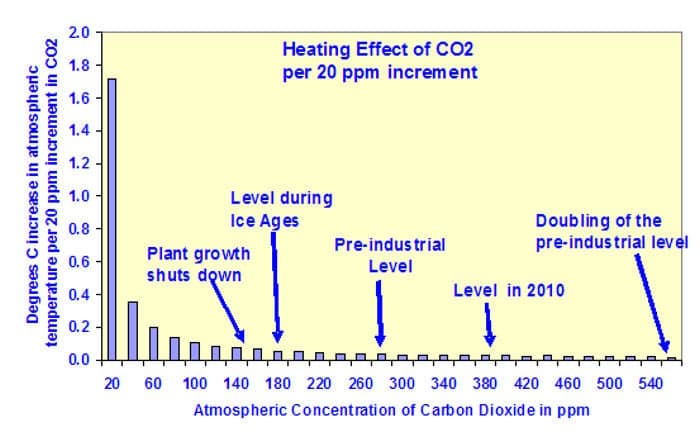
Atmospheric physics establishes that the impact of incremental additions of CO2 to the earth’s atmosphere approaches zero asymptotically, as shown in the graph below.

This means that any increase in the global average surface temperature resulting from increased atmospheric CO2 must ultimately result in the global average surface temperature asymptotically approaching a limiting temperature, all other things being held equal, which of course they are not.
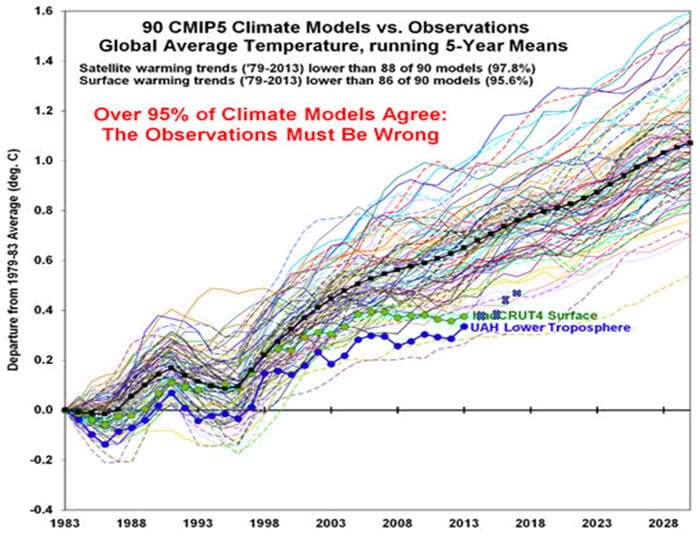
The general shape of the curves produced by the CMIP5 ensemble of climate models should therefore show an asymptotic approach to some temperature. That is clearly not the case, as shown in the graph below.

However, as shown in the graph, both the HadCRUT 4 near-surface temperature anomaly product and the UAH lower tropospheric temperature records do appear to be asymptotically approaching some limiting temperature, though the period shown in the graph is shorter than the 30-year period considered to represent climate. Since this graph was created in 2014 the annual observations have recorded a significant temperature anomaly spike resulting from a super El Nino and have now begun declining toward the paths they have followed since about 1998. The magnitude of the spike is attenuated by the 5-year means shown in the graph. The “x”s added to the graph are approximations of the 5-year means for both HadCRUT 4 and UAH. The super El Nino is not reflected in the model projections.
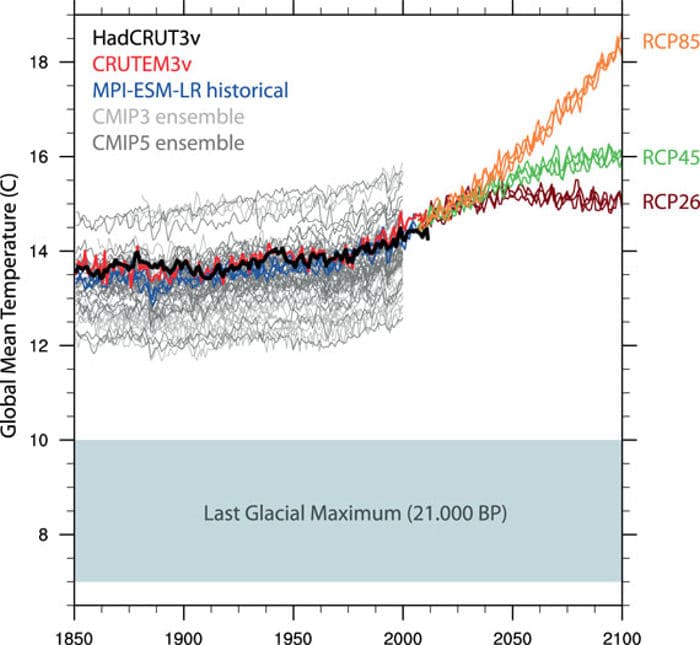
The graph below shows the future absolute temperatures projected by the ensemble of climate models, depending on the Representative Concentration Pathway (RCP) used for the analysis. The models show an asymptotic approach to approximately 15ºC around 2050, or an anomaly of approximately 1.5ºC, using RCP 2.6, then a slight decline by 2100. The absolute temperature asymptotically approaches approximately 16ºC in 2100 using RCP 4.5, or an anomaly of approximately 2.5ºC. The models do not begin to show an asymptotic approach to a temperature by 2100 using RCP 8.5; and, the approximate anomaly at that time has reached approximately 5ºC. RCP 8.5, fortunately, is showing itself to be unrealistic.

Absolute temperatures from climate model historical realizations and future scenarios. Black line is the HadCRUT3v blended land and ocean temperature dataset and red line is CRUTEM3v land-only temperatures [Brohan et al., 2006]. Blue lines are three historical realizations, while orange, green and brown are future RCP-scenario realizations with the MPI-ESM-LR model, and light gray lines are the first historical realization from each model found in the CMIP3 dataset [Meehl et al., 2007] and dark gray lines the corresponding CMIP5 historical realizations [Taylor et al., 2012]. Some model realizations were started later than 1850. The estimated Last Glacial Maximum temperature range of 4–7 K below present is from Intergovernmental Panel on Climate Change [2007].
Overview of representative concentration pathways (RCPs)
|
|
Descriptionª |
Publication—IA Model |
|
RCP8.5 |
Rising radiative forcing pathway leading to 8.5 W/m2 (~1370 ppm CO2 eq) by 2100. |
(Riahi et al. 2007)—MESSAGE |
|
RCP6 |
Stabilization without overshoot pathway to 6 W/m2 (~850 ppm CO2 eq) at stabilization after 2100 |
|
|
RCP4.5 |
Stabilization without overshoot pathway to 4.5 W/m2 (~650 ppm CO2 eq) at stabilization after 2100 |
(Clarke et al. 2007; Smith and Wigley 2006; Wise et al. 2009)—GCAM |
|
RCP2.6 |
Peak in radiative forcing at ~3 W/m2 (~490 ppm CO2 eq) before 2100 and then decline (the selected pathway declines to 2.6 W/m2 by 2100). |
ª Approximate radiative forcing levels were defined as ±5% of the stated level in W/m2 relative to pre-industrial levels. Radiative forcing values include the net effect of all anthropogenic GHGs and other forcing agents
The growing difference between the model projections and the observations has highlighted the need to improve the climate models, including a reevaluation of the climate sensitivity estimates upon which the model projections are based. This should be a high priority for climate research in the future.