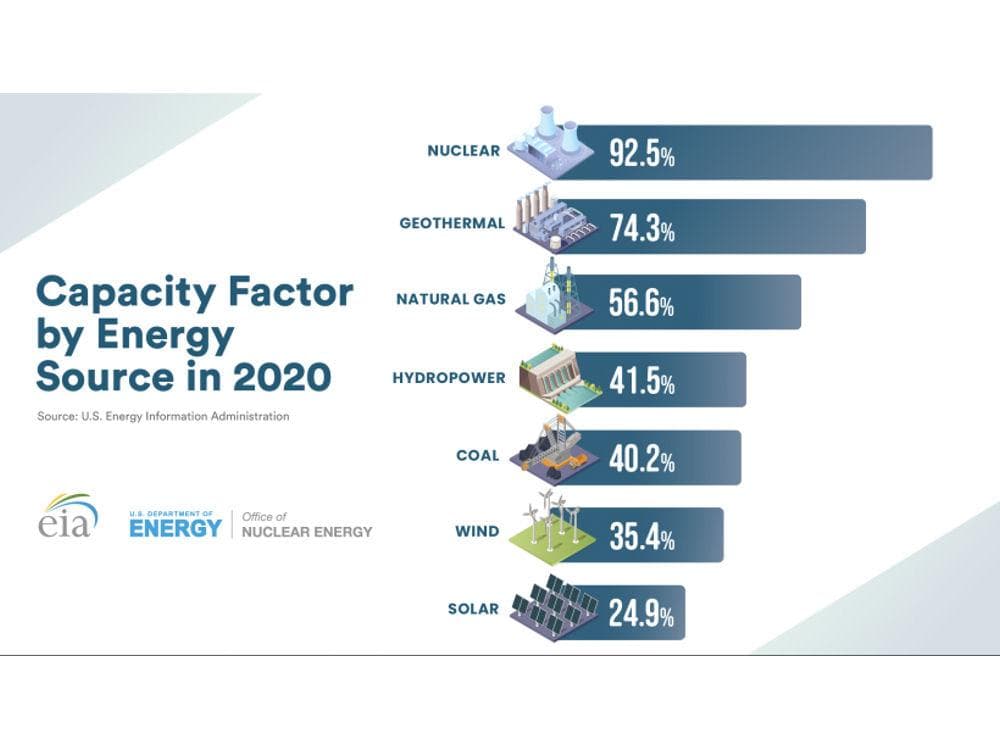

The US Department of Energy, Energy Information Administration chart below is arguably accurate but inarguably misleading.

The capacity factors shown for both wind and solar, while they are the actual percentage of rating plate capacity delivered to the grid in 2020, are also approximately equal to the limiting capacity factors of the generators as installed, since the output of both wind and solar generation have priority access to the grid.
The nuclear generation capacity factor shown above is the rating plate capacity of the nuclear generators less an allowance for downtime for maintenance and refueling. Otherwise, nuclear generators typically operate base loaded at rating plate capacity because of their low operating costs.
Geothermal generation provides a constant source of energy as required and is typically dispatched when available, with a downtime allowance of approximately 25% for maintenance and repair.
Hydroelectric generation capacity factor is largely dependent on water availability behind the dams as well as water demand downstream of the dams. A portion of the hydroelectric generation capacity is reliable, while the remainder is “source of opportunity” capacity based on water availability.
Coal and natural gas generators are typically operated in load-following mode, providing the difference between renewable and nuclear generation output and grid demand. They also typically represent the utilities’ capacity reserve margin on peak, available in the event of a failure of the utilities’ largest single generation resource. The capacity factors shown in the chart above are the actual percentage of rating plate capacity delivered to the grid in 2020. However, those generators have real capacity factors of approximately 85% for coal generation and 90% for natural gas combined cycle generation.
Of the generation sources shown in the graphic, only wind and solar are not dispatchable. Their availability is dependent upon wind and sun conditions. When they are available, they displace the output of dispatchable generators. However, the capacity of the dispatchable generators must still remain available to meet grid demand during periods of low/no wind and solar availability.
As the fraction of wind and solar generation increases, the percentage utilization of the generating capacity of coal and natural gas generators would decline, to the extent the decline is not offset by increasing grid demand or the permanent closure of these generators as a function of age, operating cost or government edict. Grid demand is expected to increase at a more rapid pace, driven by the Administration’s focus on “all-electric everything”, which would ultimately approximately triple grid demand by 2050.
The assumption is that increasing grid demand would be served by increased wind and solar generation. However, the intermittency of these generators means they would continue to require support during periods of low/no wind and solar availability. This support is now provided primarily by dispatchable fossil-fueled generators, but might also be provided by electricity storage capacity in the form of batteries or pumped storage. These storage resources would have to be in place and operating before the scheduled closure of the remaining coal generating capacity in 2030 and the remaining natural gas generating capacity by 2035.