
The World Meteorological Organization (WMO) defines climate as the sum of weather events over 30-year periods, which they refer to as climate normals. Many nations update their climate normals on a 10-year cycle, as recommended by WMO. These climate normals are then used as the basis for monitoring excursions beyond the bounds of the reference normal. The most discussed anomalies are temperature anomalies based on the current concerns about anthropogenic global warming.
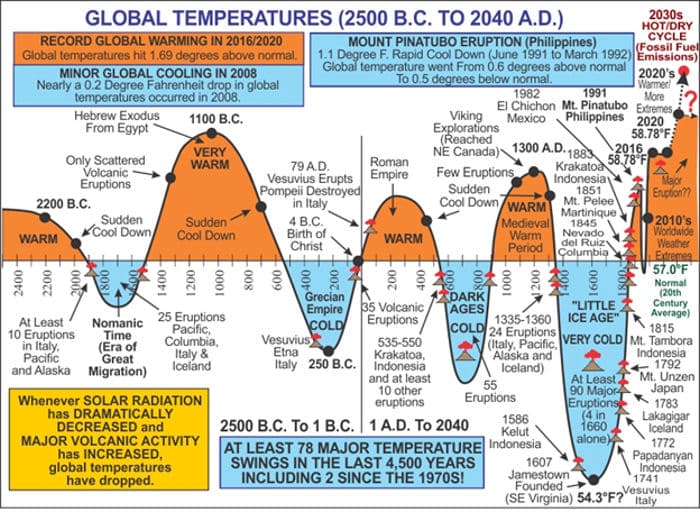
The graph below illustrates a number of long-duration climate events over the past 4500 years which produced significant temperature anomalies. The graph is based on a climate normal temperature of 57° (14°C). In the current era, the graph shows 3 warm events (Roman, Medieval and Current) and 2 cold events (Dark Ages and Little Ice Age). The graph also shows the very brief but very rapid cooling event in the 1970s, which is considered a weather event because of its short duration. Concern about anthropogenic influence on climate change began with the end of the Little Ice Age around 1850 and became more intense around 1950. The causes of the clearly cyclical climate warming and cooling cycles prior to the end of the Little Ice Age are not well understood. However, they are almost certainly not anthropogenic.

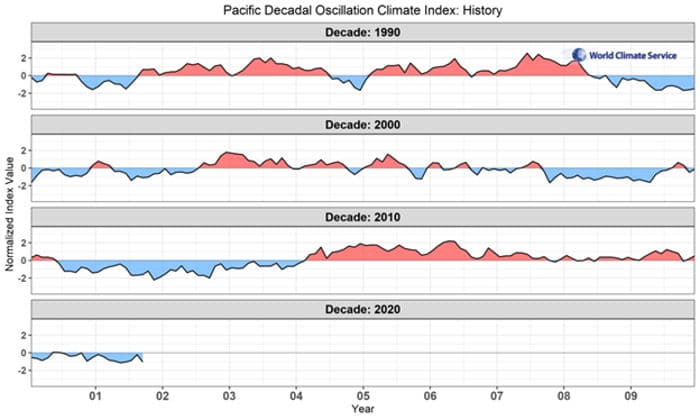
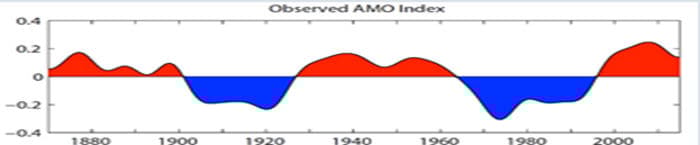
There are also several shorter-term climate events which affect weather on a large scale, including the Pacific Decadal Oscillation (PDO) and the Atlantic Multidecadal Oscillation (AMO). The PDO and the AMO transition between what are referred to as warm and cool phases. The phase transitions are not well defined and understood, and they are not generally predictable. The PDO warm plus cool phase duration ranges from approximately 40-60 years. The AMO warm plus cool phase duration ranges from approximately 60-80 years. The PDO is currently in a cool phase and the AMO is currently in a warm phase, as shown below.


The PDO graph above shows the significant variation in PDO strength and the frequent, brief excursions from phase to phase. The smoother AMO graph more clearly shows phase duration, though still showing significant variation in strength.
The PDO has significant impacts on climatic conditions and weather events affecting South America, Australia and Asia, as well as North America. The El Nino Southern Oscillation is also affected by the PDO. El Nino events are more likely to occur during the positive or warm phase of the PDO, while La Nina conditions are more likely in the negative or cool phase. The recent triple-dip La Nina occurred during the PDO cool phase, while two recent super El Nino events occurred during the PDO positive or warm phase.
The AMO has significant impacts on climate conditions and weather events in the North Atlantic Ocean and along its coasts, as well as Africa and India. The warm phase of the AMO is believed to contribute to the frequency and strength of hurricanes. However, the “drought” of major landfalling hurricanes which began in 2006 occurred during the warm phase of the AMO.
The relatively short duration of extensive, accurate measurements of sea surface temperatures and the long duration of PDO and AMO cycles makes it difficult to analyze the impacts of the phase of one of these climate events on the other. However, the differing durations of these two major climate events mean that they will not always be in the same phase or in different phases; and, the two climate events do influence each other. There remains much to be learned about these interactions.