- Coincidence: the occurrence of events that happen at the same time by accident but seem to have some connection, Merriam-Webster
- Causation: the act or agency which produces an effect, Merriam-Webster
- Contributory: of, relating to, or forming a contribution: playing a part in bringing about an end or result, Merriam-Webster
Sea Level
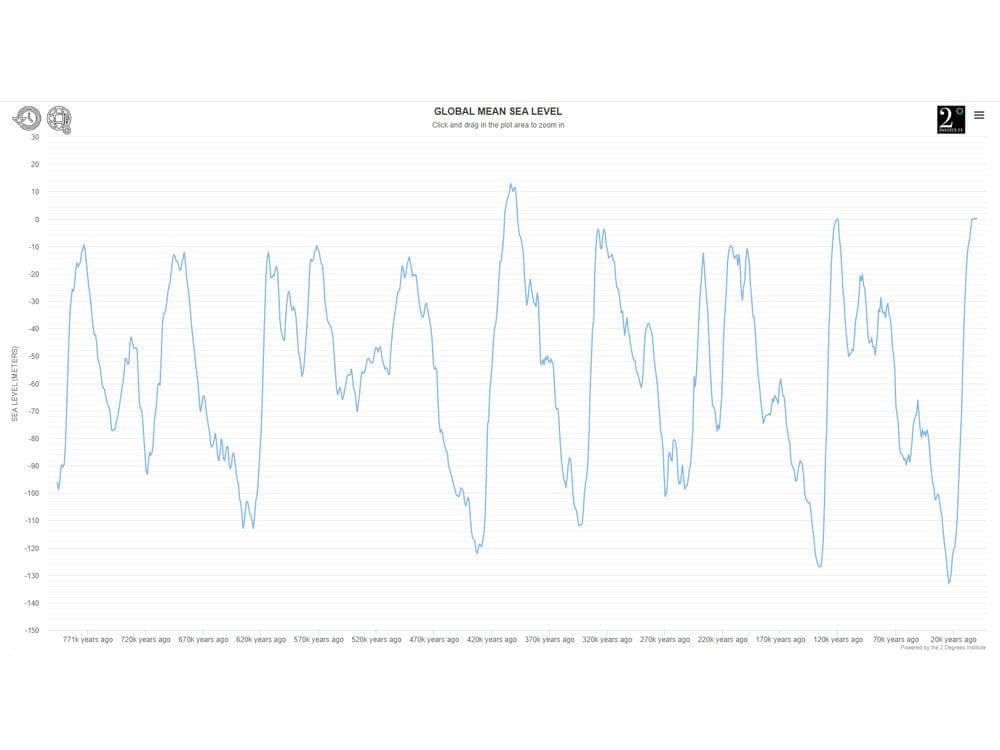
The linked graph is a paleoclimatic reconstruction of global sea level over approximately the past 800,000 years. The sea level roughly approximates a sine wave with a maximum amplitude variation of approximately 146 meters. The peak sea level positive anomaly is approximately 12.9 meters approximately 400 million years ago, while the peak negative anomaly is -133 meters approximately 20,000 years ago, both relative to a zero anomaly approximately 4,000 years ago. Clicking on the right-hand icon in the upper left corner of the page overlays the temperature anomaly on the graph.
Clicking on the left-hand icon in the upper left-hand corner of the page shifts the time scale to the most recent 1,020 years and also changes the units of measure on the “Y” axis from meters to centimeters. On this timescale, the peak sea level anomaly is +21.36 centimeters (0.214 meters), approximately 1/60th of the peak anomaly in the historical record. The increased intensity of the graph lines after 1890 is indicative of the start of “global” instrumental measurement. Clicking the right-hand icon in the upper left corner of the page overlays the temperature anomaly on the graph. The year 1000 at the left of the graph is early in the Medieval Warm Period. The period from 1350 to 1850 spans the Little Ice Age. The balance of the graph displays the Modern Warm Period through June 2020.
It is clear on both timescales that sea level follows temperature changes. The temperature and sea level changes prior to approximately 1950 are considered to represent natural variation. The rapid, short-term changes in both temperature and sea level in the instrumental record are also considered to represent natural variation. The positive and negative fluctuations in the anomalies have numerous, differing contributory causes. The causes are not well understood and their relative contributions to the positive and negative anomaly changes cannot be determined, even during the period of the instrumental temperature and sea level records.
The graph of the past 1020 years shows that the global temperature anomaly has been increasing, with significant fluctuations, since before the beginning of the instrumental records, approximately 70 years prior to 1950, when anthropogenic CO2 emissions are believed to have become significant. Therefore, during that 70-year period, it is extremely unlikely that anthropogenic CO2 emissions were the cause, or even a contributory cause, of the increasing temperature anomaly. The global sea level anomaly did not begin to increase until the beginning of the instrumental record and appears to lag the increasing temperature anomaly by approximately 80 years.
Since 1950, the temperature and sea level anomalies and atmospheric CO2 concentrations have been increasing. There is no scientific reason to believe that the forces which caused increasing temperature and sea level anomalies over the period from 1880-1950 ceased to function after 1950. Therefore, it is highly unlikely that the temperature and sea level anomaly increases from 1950-2020 were caused by increasing atmospheric CO2. Physics suggests that increased atmospheric CO2 concentrations should increase global temperatures and global sea levels, so it is also highly unlikely that the post-1950 temperature anomaly increase is a mere coincidence. Rather, increasing atmospheric CO2 concentrations are most likely a contributing factor to the temperature and sea level anomaly increases, though the relative magnitude of the CO2 effect cannot be measured.