
“It doesn't matter how beautiful your theory is, it doesn't matter how smart you are. If it doesn't agree with experiment, it's wrong.” --Richard P. Feynman
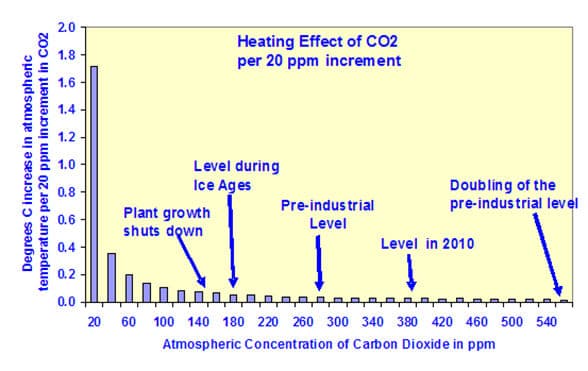
The impact of incremental increases in atmospheric CO2 concentrations diminishes as the CO2 concentration increases, as illustrated by this graph.

The author notes that “the first 20 ppm accounts for over half of the heating effect to the pre-industrial level of 280 ppm”. Equally important is that the impact of increased atmospheric CO2, from whatever source, is approaching zero asymptotically.
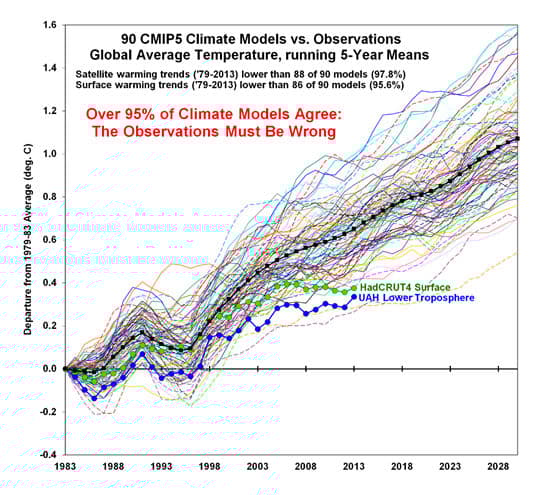
The range of climate models included in the Climate Model Intercomparison Project (CMIP5) largely do not illustrate an asymptotic approach to a limiting anomaly value, as would be expected, as illustrated in this graph. However, both the HadCRUT4 near-surface temperature anomaly and the UAH Lower Atmosphere temperature anomaly appear to demonstrate the beginning of an asymptotic approach to a limiting anomaly value, which would be substantially lower than might be indicated by most of the climate models. This apparent asymptotic approach coincides with the “hiatus” or “pause” which followed the 1998 super El Nino.

Numerous recent research papers have suggested far lower climate sensitivity to increased atmospheric CO2 concentrations than the climate sensitivity estimates used by the CMIP5 climate model scenarios shown above. Co-author of the paper “ Lewis N and Curry J A: The implications for climate sensitivity of AR5 forcing and heat uptake estimates, Climate Dynamics (2014)”, Nic Lewis, explains their study here. The results reported in these papers are consistent with the appearance of an approach to a limiting climate anomaly in both the near-surface and satellite anomalies, as shown above. While the duration of the flattening of the anomaly curves above is too short to be considered a climate change, it is certainly an indication that there are effects occurring in the climate which are not predicted by the models.
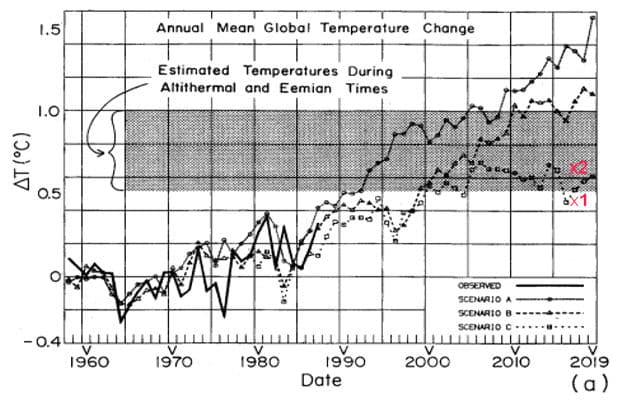
The time frame shown in the graph above begins shortly after the beginning of the satellite era. A longer time frame is available in the graph below, produced by Dr. James E. Hansen of NASA GISS in 1988.

The lowest line on the graph, Scenario “C”, assumes drastically lower emissions beginning between 1990 and 2000. The point “x1” indicates the value of the UAH satellite anomaly as of June 2017. The point “x2” indicates the value of the HadCRUT4 anomaly as of June 2017. The calculated anomalies are consistent with Scenario “C”, though actual emissions history is consistent with Scenario “A”; and, are also consistent with lower climate sensitivity.
The consensed climate science community has begun to acknowledge the widening gap between the climate scenarios produced by the CMIP5 climate models and the anomalies calculated by NOAA / NCEI, NASA GISS, HadCRUT, UAH and RSS. However, that has not yet ended the persistent claim that “the science is settled” and that “the time for debate is over”, nor has it ended EPA Administrator Pruitt’s call for a Red Team / Blue Team exercise on climate change.
“It ain’t over till it’s over.”, Yogi Berra, American philosopher