Model projections of future climate focus on temperature anomalies compared to temperatures in a 30-year climate reference period. The inputs to these models include estimates of climate sensitivity, solar forcing, atmospheric feedback and the future rate of change of atmospheric CO2 and other “greenhouse gases”. The temperatures which form the 30-year climate reference period are estimates, since the actual data have been “adjusted”, “infilled”, “homogenized” and have also been affected by site moves, instrument changes, instrument drift, site deterioration and the Urban Heat Island (UHI) effect. Temperatures more recent than the end of the 30-year climate reference period are also estimates, for the reasons cited above.
Global temperature and temperature anomaly measurements consist of both near-surface temperature measurements over land and sea surface temperatures over the global oceans. The global oceans comprise approximately 71% of the globe’s surface, or more than twice the land surface area. Ocean surface temperatures are also estimates, since the actual data is subject to all of the issues listed above for near-surface land temperatures, with the exception of UHI. Ocean temperature measurements are also sparse compared to near-surface land temperature measurements, so large areas of the global oceans remain unmeasured.
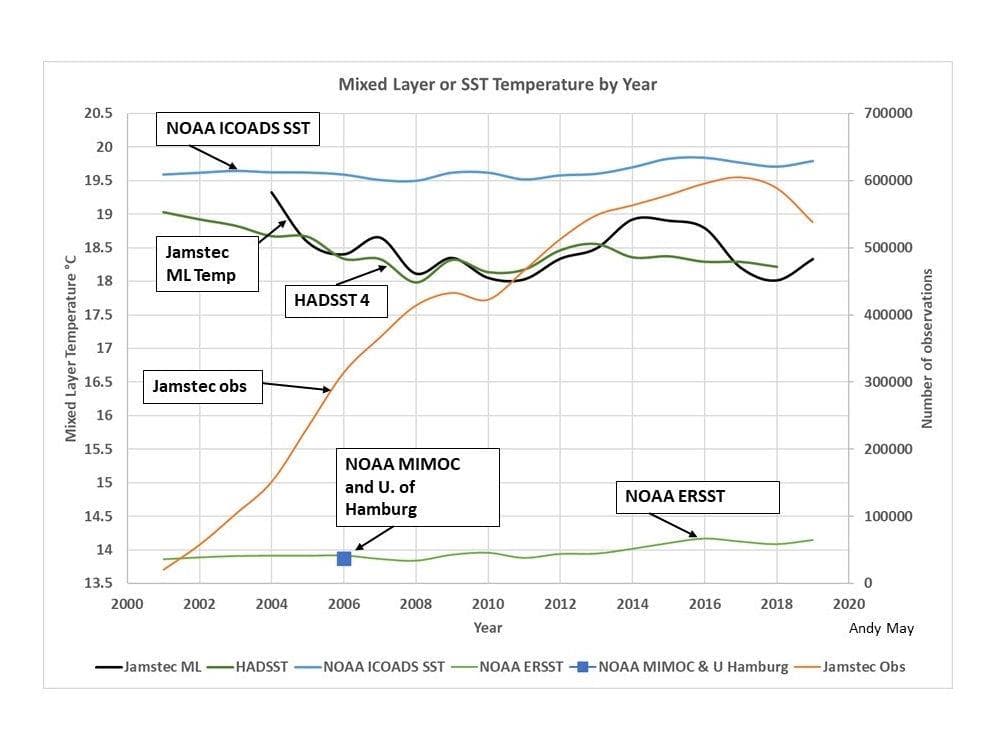
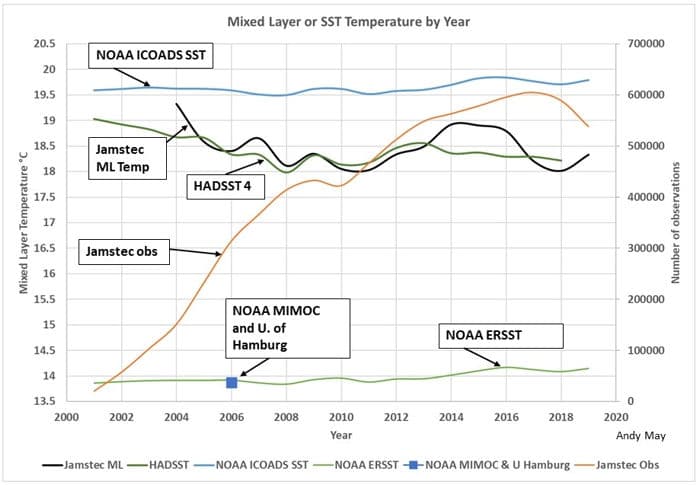
A recent series of articles by Andy May (here, here and here) present and compare ocean surface temperature analyses reported by several agencies involved in climate change analysis, as shown in the graph below. The graphed lines represent calculated ocean temperatures, rather than anomalies, based on the available ocean temperature data. It is important to note that the same measurements form the basis for all of the reported sea surface temperatures over the period shown in the graph. It is also important to note that the two NOAA sea surface temperature estimates differ by ~5.5°C and that the temperature trends represented by the graph lines are significantly different.
The two NOAA graph lines display a very slight upward trend in estimated sea surface temperatures, while HADSST4 shows a downward trend approximately three times as large as the NOAA upward trend. Note that the graph lines are based on temperature estimates reported to two decimal places. The two NOAA graph lines display virtually identical temperature trends, though the temperature estimates differ by ~5.5°C.
The various agencies which report global average temperature anomaly changes combine the anomalies in these sea surface temperature analyses with the anomalies reported for the near-surface land temperatures. The global average temperature anomaly changes are then reported to two decimal place precision and there is great interest in reported year to year changes of 0.01°C. The precision in the anomaly reporting is greater than the accuracy of the underlying data, even after “adjustment”.
The differences in the reported sea surface temperatures are one of the major reasons why global temperature changes are reported as anomalies, rather than absolute temperatures. However, since the reported average temperature for the climate reference period is an estimate and the reported temperature anomaly is also an estimate, reporting annual changes to two decimal place precision is totally unjustified.
