
Definition of confidence (Entry 1 of 2)
: a feeling or consciousness of one's powers or of reliance on one's circumstances
Definition of confidence (Entry 2 of 2)
: of, relating to, or adept at swindling by false promises
IPCC Guidance regarding confidence
A level of confidence is expressed using five qualifiers:
“very low,” “low,” “medium,” “high,” and “very high.” It
synthesizes the author teams’ judgments about the validity
of findings as determined through evaluation of evidence
and agreement. Figure 1 depicts summary statements
for evidence and agreement and their relationship to
confidence.
The IPCC AR6 Summary for Policymakers begins with the following Headline Statement:
It is unequivocal that human influence has warmed the atmosphere, ocean and land. Widespread and rapid changes in the atmosphere, ocean, cryosphere and biosphere have occurred.
This “unequivocal” statement is very carefully worded, as is the entire Summary for Policymakers. The specific human influences are not listed, nor are their relative contributions identified. The specific changes in the “atmosphere, ocean, cryosphere and biosphere” are also not listed, nor are they asserted to be “unequivocal”.
There is little doubt that increasing global population, clearing of forest land for cultivation, construction and expansion of cities, roads and highways and emissions of greenhouse gases cause warming of the local and regional climate and that the accumulation of this local and regional warming has warmed earth’s atmosphere. However, there is also little doubt that the natural variation in earth’s climate continues as well. It is not currently possible to separate the effects of human influence from the effects of natural variability.
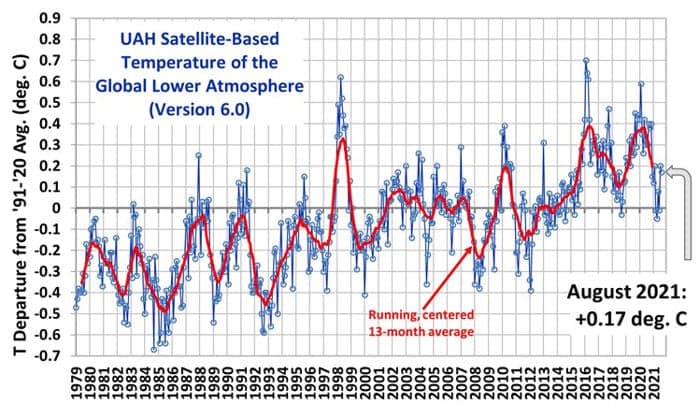
The graph below prepared by Dr. Roy Spencer displays the entire history of satellite atmospheric temperature measurement. Even if one assumes that the increase in atmospheric temperature over the period is the result of human influence, the very rapid changes of atmospheric temperature above and below the trend line are clear and unequivocal evidence of the existence of natural variation, driven largely by ENSO events.

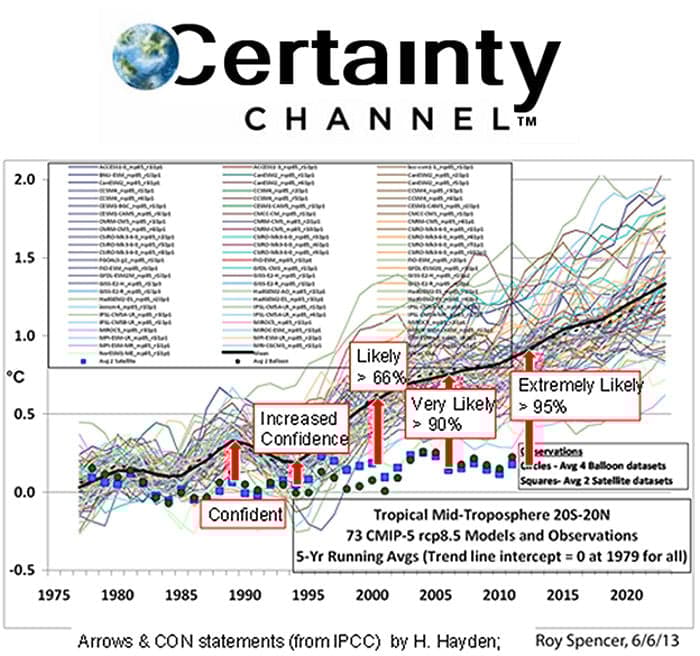
The graph below illustrates the evolution of IPCC “confidence” and “likelihood” assessments regarding CMIP5 climate model projections and contrasts them with the growing gap between the climate model projections and observations of both near-surface (adjusted) and satellite temperature.

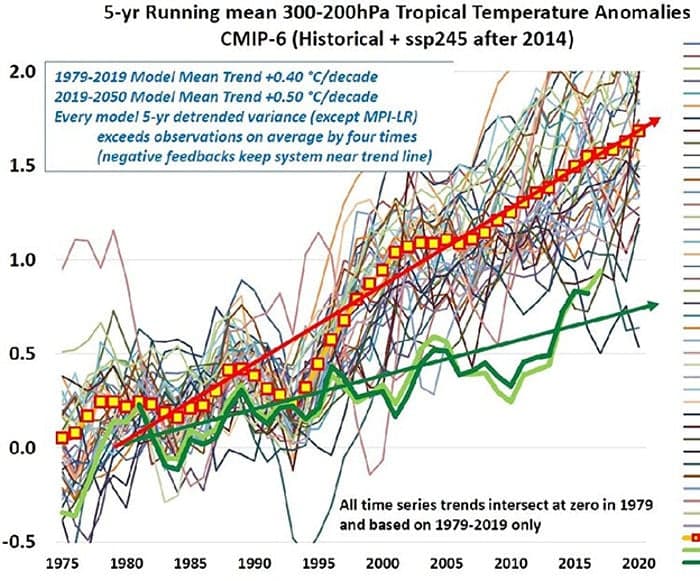
The graph below by Dr. John Christy illustrates that the difference between model projections of temperature and observed temperature continues to grow in the CMIP6 model ensemble, while IPCC confidence in the likelihood of the model projections eventuating remains very high.

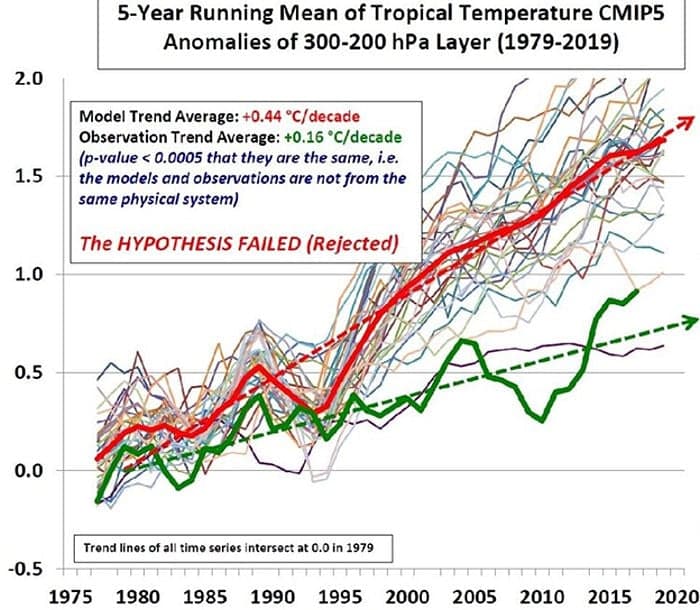
Dr. Christy concluded that the hypothesis embodied in the CMIP5 model ensemble had failed.

It appears clear that the hypothesis embodied in the CMIP6 models also fails, despite the IPCC’s apparent high confidence.
The IPCC guidance regarding confidence printed above speaks to evaluation of evidence and agreement. The observation trend shown in green above, while tainted by “adjustment”, is evidence of the warming global atmosphere. The model trend average shown in red above is representative of “agreement” by the IPCC parties, but is evidence that the models do not model the real atmosphere.