The “ideal” climate apparently centers about a global annual average temperature of approximately 57°F, the global annual average temperature of the climatological reference period most commonly used in climate science. The annual average temperatures of the individual nations of the globe range from 22°F in Canada to 83°F in Burkina Faso. The annual average maximum and minimum temperatures tend to lie within +/- 5-10°F of the annual average, while the annual maximum and minimum temperature range tends to be 5-10 times as large.
With that range of conditions as background, we are told that the current global annual average temperature anomaly of ~1.6°F should be cause for great concern; and, that beyond twice that anomaly lies impending catastrophe. The expressions of concern would suggest that the global maximum average temperature is increasing and that the higher temperatures would cause crop failures and increased deaths from heat-related conditions.
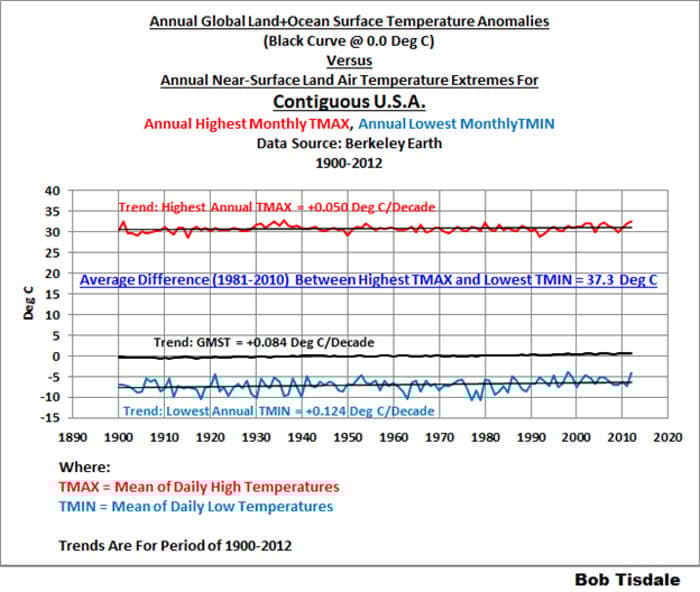
What those expressions of concern fail to mention is that the global annual average minimum temperatures are also rising, typically at approximately twice the rate of increase of the global annual average maximum temperatures. Since the global annual average temperature is the mean of the global annual maximum and minimum temperatures, this means that the 1.6°F global annual temperature anomaly consists of an increase in the maximum temperature of ~0.6°F and an increase in the minimum temperature of ~1.0°F.
The graph below from a post by Bob Tisdale illustrates this situation for the contiguous United States for the period 1900 – 2012. Note that the graph displays the land plus ocean surface temperature trends; and, that the surface only trends would show greater range and variation.

The rate of increase of the maximum temperature is approximately 70% of the rate of increase of the mean temperature, while the rate of increase of the minimum temperature is approximately 150% of the rate of increase of the mean temperature. This means that, in the US, climate change is manifesting as slightly warmer summers and warmer winters and as slightly warmer days and warmer nights.
The post linked above displays similar graphs for nine other countries: China; India; Indonesia; Brazil; Pakistan; Nigeria; Bangladesh; Russia and, Mexico. The US and these countries contain approximately 60% of the population of the globe. In all these countries, with the exception of Mexico, the rate of increase of the minimum temperature is higher than the rate of increase of the maximum temperature. In China, the rate of increase of the minimum temperature is approximately 30 times the rate of increase of the maximum temperature, the largest ratio for the 10 countries. In Mexico, the rate of increase of the maximum temperature is approximately 30% greater than the rate of increase of the minimum temperature.
The average difference during the climate reference period (1981-2010) between the highest maximum temperature and the lowest minimum temperature for these ten countries ranges from 50°F to 124°F. Against this background, an increase of 0.6°F in the average maximum temperature and an increase in the average minimum temperature of 1°F do not seem particularly significant.