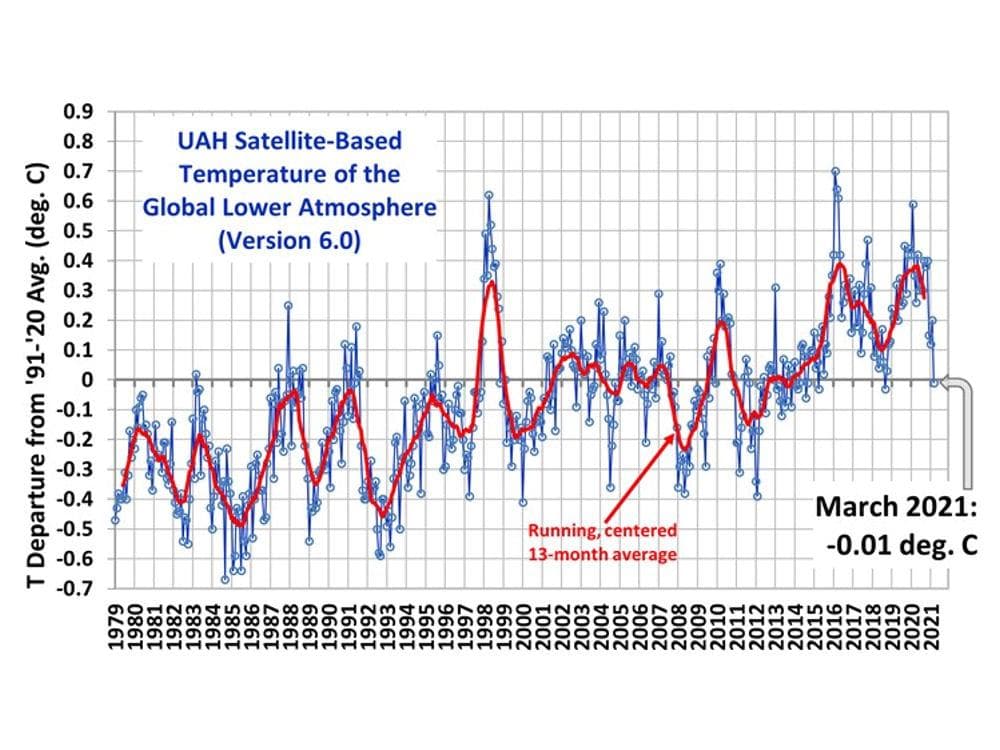
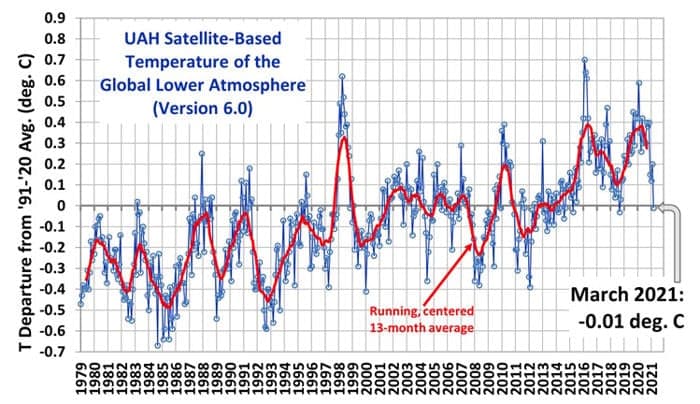
The graph below, from UAH, shows the entire history of satellite global temperature anomalies through March 2021.

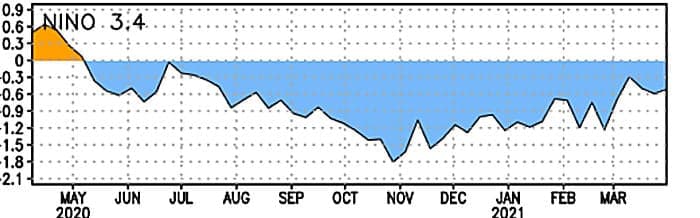
Dr. Roy Spencer of UAH suggested in January 2021 that the significant decrease in the global average temperature anomaly in December 2020 was the beginning of the impact of the La Nina which began in May 2020 and has continued for the past 11 months, as shown in the graph below. The La Nina peaked in late October 2020 as a “strong” La Nina. While the La Nina has weakened since its October peak, it has persisted through the end of March 2021 and may continue. The global average temperature anomaly has decreased further since December 2020, to a low of -0.01°C at the end of March 2021. This represents a total decrease of approximately 0.4°C since the peak of the current La Nina. The delayed reflection of the La Nina in the satellite temperature anomaly data suggests that the anomaly will decrease further as the La Nina persists.

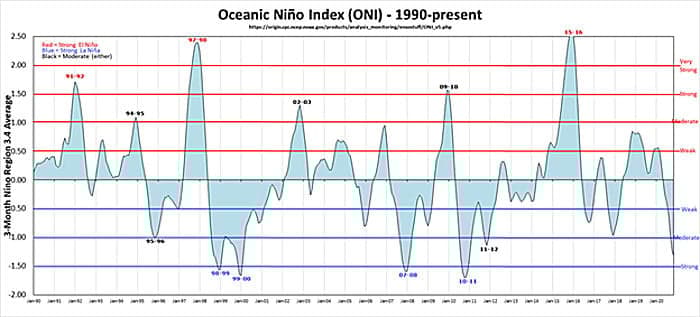
The current La Nina has been the strongest La Nina in the past 30 years, as shown in the graph below. However, it was significantly weaker than the super El Ninos in 1997-1998 and 2015-2016.

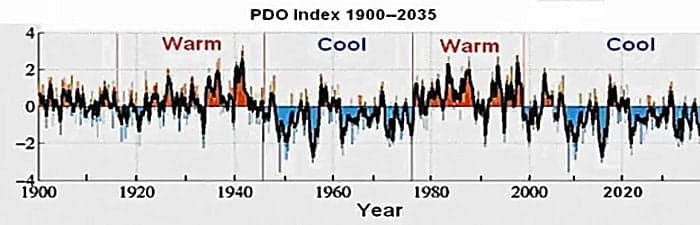
The Pacific Decadal Oscillation (PDO) shifted to its cool phase in 2005 and is likely to remain in its cool phase until approximately 2040, as shown in the graph below. There are typically more frequent and stronger La Ninas during the cool phase of the PDO, so it is possible that there will be further reductions in the global average temperature anomaly over the next two decades triggered by additional strong La Ninas.

The super El Ninos of 1997-1998 and 2015-2016 each increased the global average temperature anomaly by approximately 0.5°C. These El Ninos pumped significant heat into the atmosphere which can take several years to dissipate.
Climate science does not yet understand what controls the El Nino Southern Oscillation (ENSO) cycles, nor is it able to predict their onset or intensity, nor how long it will take for their impact to dissipate. Climate science is also not able to predict the shift in the phases of the PDO, nor does it completely understand how this shift impacts weather and climate. The same is true for the other ocean cycles, such as the Atlantic Multi-decadal Oscillation, which is thought to have a significant impact on the frequency and intensity of Atlantic hurricanes.
Consensus climate theory attributes most, all and even more than all recent global warming to the increase in anthropogenic CO2 in the atmosphere. However, the relatively continual increase in atmospheric CO2 would be very unlikely to produce the rapid swings in the temperature anomaly shown in the satellite temperature graph above. Rather, these temperature anomaly swings are the result of a poorly understood combination of climate events such as the PDO switch and weather events such as the ENSO cycles.