The consensed climate science community attributes the approximately 1°C increase in global annual temperatures since 1880 to anthropogenic CO2 emissions; and, discounts the effects of natural climate variability. Great concern is expressed over the rate of change of the global average temperature anomaly (~0.7°C/century), which is claimed to be the most rapid rise in the historical record.
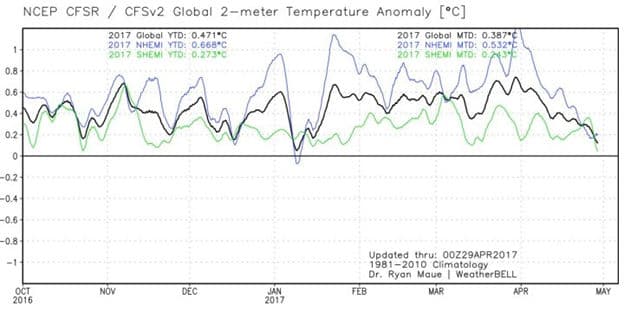
However, as shown in the graph below from the National Centers for Environmental Prediction, natural variability still exists; and, it can result in changes in the global average temperature anomaly far more rapid than the change attributed largely to human influences. The seven months of daily anomalies cover the emergence from the 2015/2016 Super El Nino.

The two most dramatic features of the graph are the rapid temperature anomaly excursions in January, 2017 and April, 2017. In early January, the global anomaly declines rapidly by slightly more than 0.5°C, then rapidly rebounds by approximately 0.6°C. In April, the global anomaly again declines by approximately 0.5°C. These rapid changes, which are each equal to or greater than half the anomaly change over the past 135 years, occurred over a period of 15-30 days, or at a rate of approximately 600 times the rate of change attributed to human influences.
These two features are even more dramatic when only the Northern Hemisphere is considered. The Northern Hemisphere anomaly declines by slightly more than 1°C in early January, then rapidly rebounds by more than 1.2°C in mid-January. In April, the anomaly again declines rapidly by more than 1.1°C. These anomaly changes occurred at a rate approximately 1200 times the rate of change attributed to human influences.
It is interesting to note that the Southern Hemisphere, which contains far less land surface and thus far more ocean surface than the Northern Hemisphere, experiences far more tightly constrained variations; and, that these variations are out of phase with the larger variations in the Northern Hemisphere. The Southern Hemisphere anomaly is less than 60% of the global anomaly during the period.
It is also interesting to note that the 2017 year-to-date anomaly is averaging approximately half the global anomaly increase attributed to human influence.
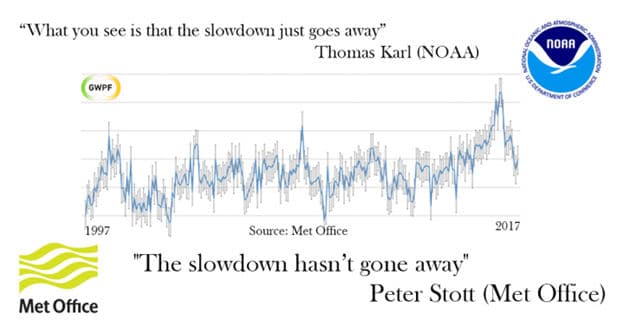
The consensed climate community has also concluded that the pause in global temperature anomalies over the past 20+ years did not happen, based on a reanalysis of sea surface temperature estimates reported in Karl et al 2015. However, as illustrated by the graph below, natural variability continues to exist in the earth’s oceans as well.

There is no known human influence which would cause sea surface temperatures to decline precipitously, as they did in the last few months shown in the graph above, nor is there any human influence capable of causing the rapid increases and decreases shown in the remainder of the graph.
The consensed climate science community has been very quick to attribute increases in global temperature anomalies to human influence; and, to minimize the impacts of natural phenomena, such as El Nino and La Nina events, on those anomalies. They have been far less forthcoming with explanations of declines in the anomalies, such as those discussed above.