Climate Sensitivity
The IPCC has recently lowered its estimated range of climate sensitivity to a doubling of atmospheric CO2 concentration. The IPCC AR6 estimated range is 2.5-4.0, with an expected value of 3.0. However, studies conducted by several researchers have produced estimates at or below the bottom of the range estimated by AR6.
- Lewis & Curry 1.5 – 1.8C
- Lewis 2.16C
- Spencer 2.09C
- Monckton 1.3C
- Scafetta 1.0-2.5C
- Lindzen & Choi 1.0-2.5C
- van Wijngaarden & Happer 2.2-2.3C
Resource Consumption Pathways
The IPCC has recently acknowledged that RCP8.5 represents an implausible future. IPCC is now using RCP4.5 as the “business as usual” future pathway, which reduces the expected range of potential global warming.
However, RCP8.5 is still being used as the basis for numerous studies intended to produce “scary scenarios” of the effects of future climate change. Dr. Roger Pielke, Jr. reports that such studies are being published at the rate of approximately 20 per day. Such studies add nothing to the understanding of the science and consume funds which could be far more usefully applied.
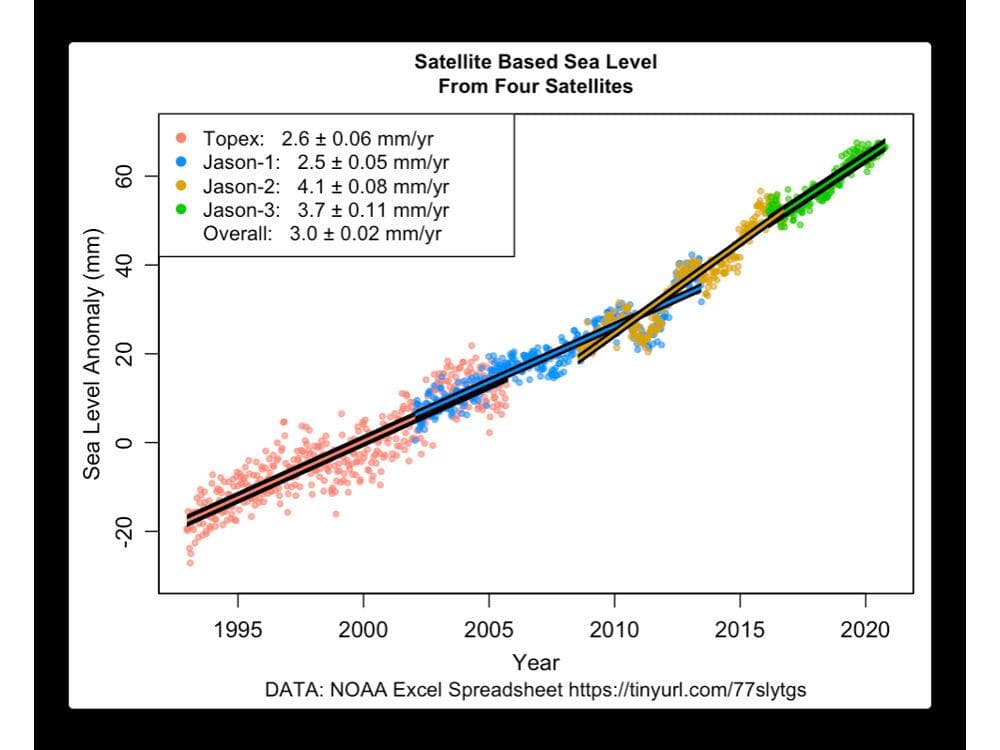
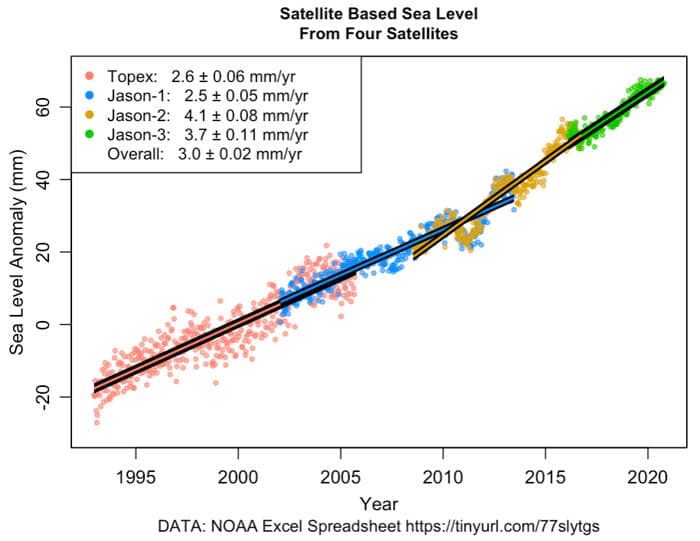
Satellite Sea Level Rise
A paper published in Nature Scientific Reports determines that the much-discussed acceleration in sea level rise supposedly measured by NASA satellites is instead an artifact of sequentially combining the output of measurements made from four different satellites. The study determined that, after correction, the supposed acceleration in sea level rise was not significantly different from zero at the 95% confidence level.

However, the rate of sea level rise reported from satellite measurements is still approximately twice the rate of rise in the much longer tide gauge measurements. Regardless, sea level has been rising since the trough of the Little Ice Age at a consistent rate, with no indication of climate change driven acceleration.
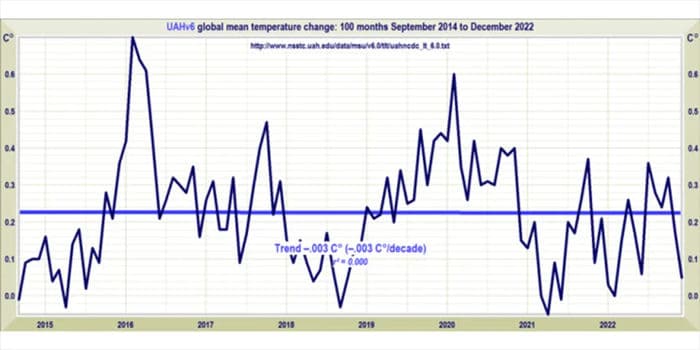
Satellite Tropospheric Temperature Anomaly
The satellite tropospheric temperature anomaly record shows the development of another “pause” in atmospheric warming, now stretching to 8 years 4 months, as shown in the graph below. The previous “pause”, which extended from 1998 – 2013, was controversial, resulting in more than 60 studies explaining its cause and other studies claiming it had not happened. The current “pause” is not as controversial, though it would likely become more controversial if it extended to 15-year duration. The previous pause was arguably triggered by the 1998 super El Nino and ended by the runup to the 2016 super El Nino. The current “pause” was arguably triggered by the current triple La Nina and will likely end with the end of the La Nina.

Near-Surface Temperature Anomaly UHI Distortion
Dr. Roy Spencer has begun a series of analyses of the effects of urbanization and the resulting Urban Heat Island effect on the near-surface temperature record. His analysis of US East Coast cities suggests that the rate of temperature anomaly increase in the near-surface temperature data is approximately 50% too large. The UHI effect appears to have the greatest impact on daily low temperatures, as heat absorbed by urban infrastructure during the day is released to the surrounding atmosphere, partially offsetting normal nighttime cooling.
Summary
Each of the situations above strongly suggests that there is no climate crisis and that the effects of climate change will likely be far less adverse than projected by the “scary scenarios”.