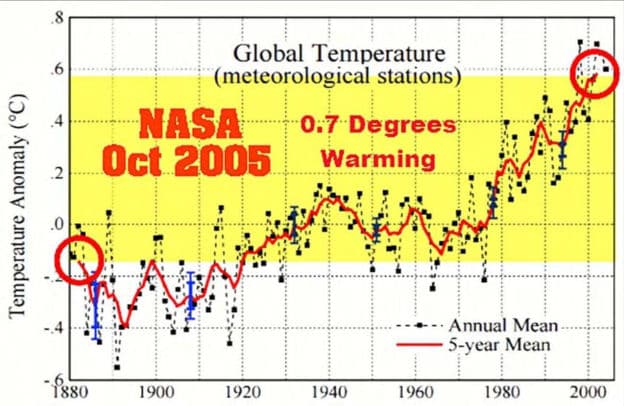
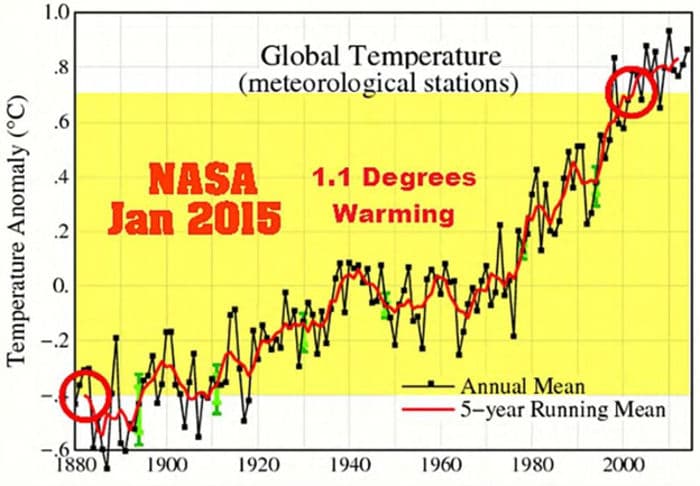

The graphs below were prepared and published by NASA in October, 2005 and in January and October, 2015. The graphs were highlighted and annotated by Professor Howard Cork Hayden to call attention to changes made to the historical near-surface temperature anomaly record. All three graphs are based on the same historical data for the period 1880 – 2005. The two 2015 graphs contain additional temperature anomaly results based on additional data for the period 2005 – 2015.
.jpg)
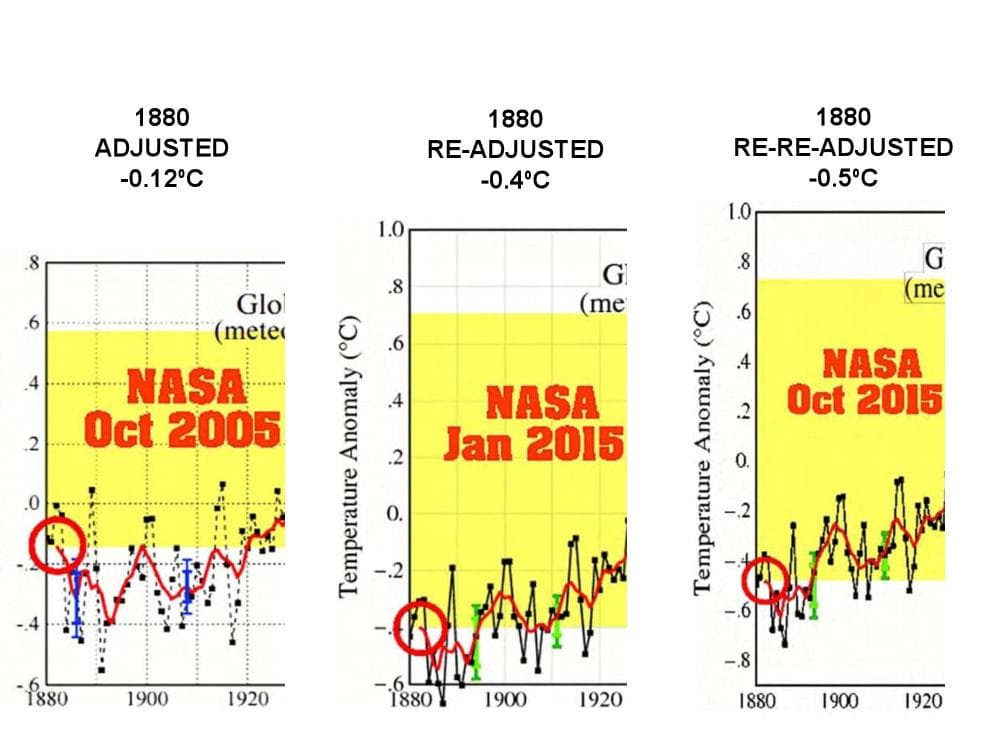
The 2005 near-surface temperature anomaly value is the same in each of the three graphs, as indicated by the red circles at the upper bounds of the highlighted areas. However, the 1880 near-surface temperature anomaly values are not the same in the three graphs, as indicated by the red circles at the lower bounds of the highlighted areas.
The 1880 near-surface temperature anomaly value is -0.12ºC in the October 2005 graph above. However, the 1880 near-surface temperature anomaly value is reduced to -0.4ºC in the January 2015 graph below; and, reduced again to -0.5ºC in the October 2015 graph. These reductions, a factor of +4ºC in total, increase the reported temperature anomaly increase over the 1880 – 2005 period by 0.5ºC, or ~70%.

It should be obvious that NASA collected no new data from the 1880 – 1940 period over which the changes in the anomaly values were made. Rather, the temperature data which had been “adjusted” prior to computing the anomalies shown in the 2005 graph, were “readjusted” prior to the publication of the January 2015 graph and again prior to the publication of the October 2015 graph.

Data are immutable. However, NASA “adjusted” temperature anomalies appear to be both highly and multiply mutable. The changes shown in the three graphs reproduced above clearly demonstrate that the three different values for the 1880 anomaly cannot all be accurate; and, raise the question of whether any of the values are accurate. In fact, virtually all of the annual anomaly values for the period 1880 – 1940 have been “readjusted” since the graph was published in October 2005.
It is also important to recall that the temperature data used to calculate the anomalies shown in the graphs above had been “adjusted” by NOAA before being submitted to NASA GISS (Goddard Institute for Space Studies), which then further “adjusted” the anomalies before producing the graphs. While the adjustments to the historical data do not affect the value of the current anomaly, they do affect the magnitude of the total anomaly since 1880; and, they affect the rate of change of the anomalies over the period since 1880.
Changes to the calculated historical anomalies, such as those illustrated in the three graphs above, raise significant questions about the accuracy and the value of the near-surface temperature anomaly records. Assignment of a Tiger Team to review the accuracy of the near-surface temperature anomaly products produced by NOAA and NASA and the justification for the multiple “adjustments” and “readjustments” to the temperature data and temperature anomaly products should be a precursor to any Red Team / Blue Team debate which allowed those records to be used as evidence.