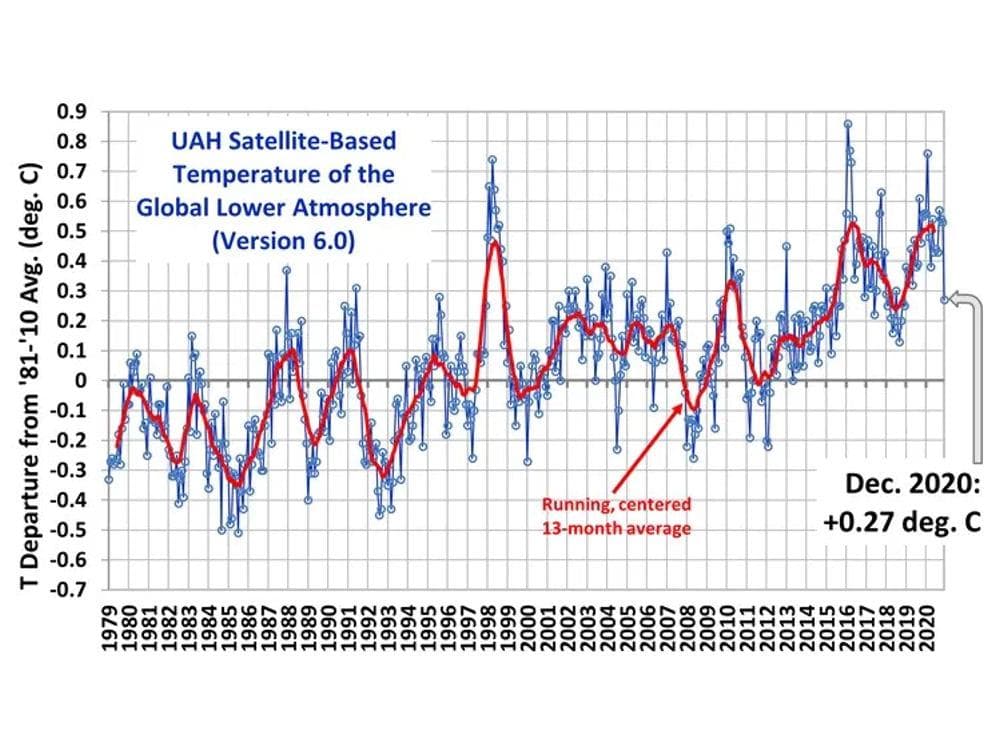
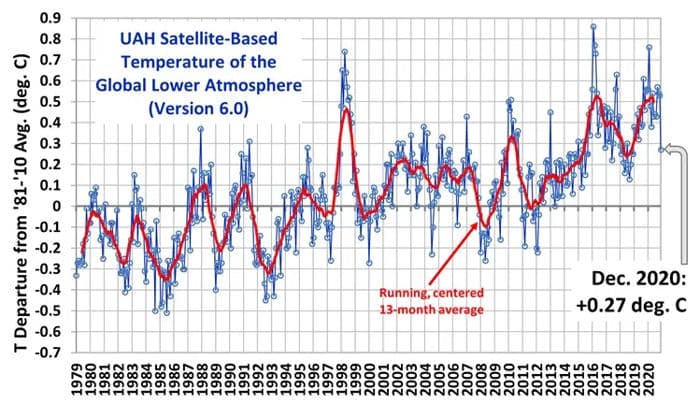
University of Alabama Huntsville (UAH) has released their analysis of lower atmosphere temperature anomalies through December 2020. The current graph is shown below.

The temperature anomaly decreased by 0.26°C in December 2020, from 0.53°C in November. Dr. Roy Spencer noted that 2020 was the second warmest year in the 42-year satellite record at 0.49°C, compared to 0.53°C in 2016, which was a super El Nino year. The peak monthly anomaly in 2020 was 0.75°C in February, marking the peak of the 2019/2020 El Nino, comparable to the peak temperature in 1998, which was also a super El Nino year.
Dr. Spencer believes that the rapid drop in the anomaly in December marked the beginning of the impact of the current La Nina, which began in the fall of 2020. NOAA expects the current La Nina to persist through at least early Spring and perhaps through the Spring of 2021. It remains to be seen how strong the current La Nina will become, but Southern California Weather Force has issued a super La Nina warning for 2021, projecting the strongest La Nina in recorded history.
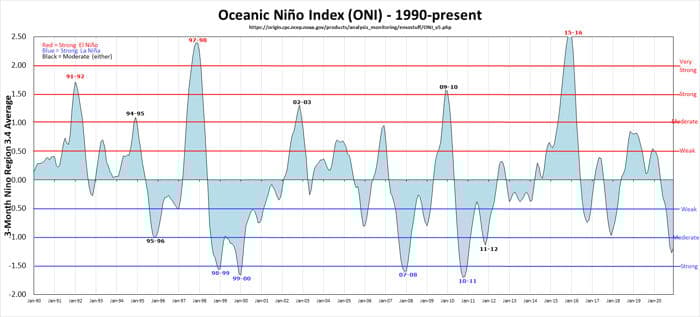
The graph below shows the ENSO index values from 1990 – 2020. Note the super El Nino events in 1997/1998 and 2015/2016. Also note that there has not been a very strong or super La Nina during this period. The current La Nina was approaching strong at the end of 2020.

Note that ENSO events are not climate events, because of their short duration, but rather weather events. However, both El Nino and La Nina events can have major impacts on global temperatures, as shown in the UAH graph of lower atmosphere temperatures. Note also that, while temperature anomalies returned to pre-El Nino levels after the 1997/1998 and 2009/2010 El Nino events, they did not do so after the 2015/2016 super El Nino. In that case, temperature anomalies remained approximately 0.25°C warmer. There is no basis on which to estimate how long it might take for this residual heat to dissipate if it does.
The Pacific Ocean experienced a Great Pacific Climate Shift in 1977, when the Pacific Decadal Oscillation shifted from its cold phase to its warm phase. It appears that the Pacific Ocean might be in the process of shifting back to its cold stage with the start of the current La Nina. The warm phase of the PDO is characterized by more El Nino events than La Nina events, which would tend to leave residual heat from the El Nino events. The cold phase of the PDO is characterized by more La Nina events, which should tend to reduce or remove the residual heat left by the more frequent and stronger El Nino events during the warm phase.
The Great Pacific Climate Shift began before the satellite era, so it is not captured in the UAH graph above. However, it appears that the residual heat remaining after the 1997/1998 and 2015/2016 El Nino events was captured by the UAH anomaly measurements. It will be interesting to see whether the PDO cold mode shift and the current La Nina will remove some or all of the residual heat.