The temperature measurements taken to produce the global near-surface temperature anomaly record are “adjusted” for a variety of reasons. However, the measurements are not “adjusted” once, to achieve a hopefully more accurate value. The graph below, produced by climate4you.com, illustrates the “adjustment” history of calculated temperature anomaly for two specific months in the past, over a period of 10 years, from 2008 to present.

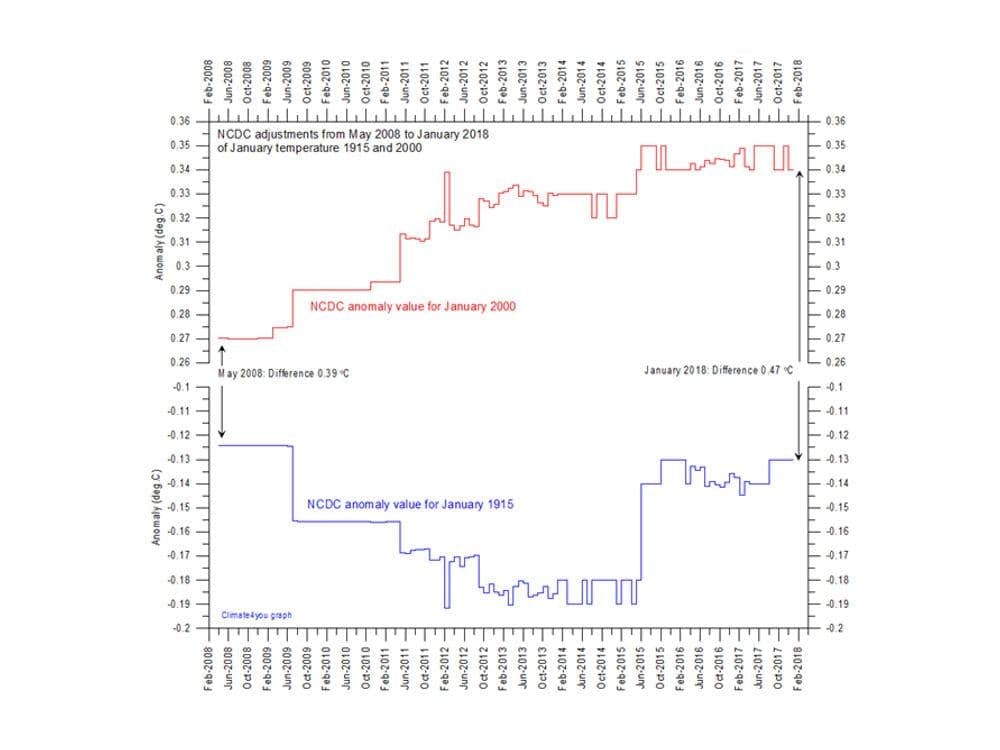
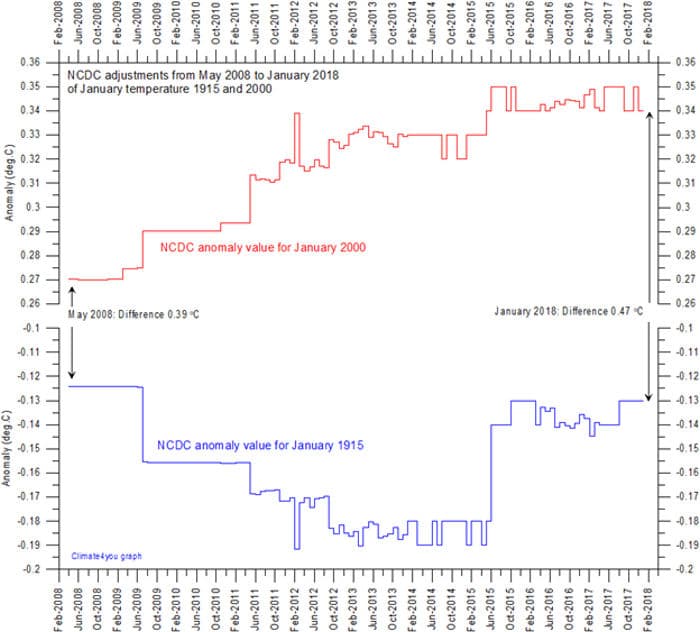
The National Climatic Data Center (NCDC) temperature anomaly value for the month of January 2000 was “adjusted” more than 40 times over the 10-year period from May 2008 to January 2018. While there were both positive and negative “adjustments” made to the calculated temperature anomaly, the net result was an increase of 0.07oC, or more than a 25% increase from the earliest anomaly value shown in the graph.
The NCDC temperature anomaly value for January 1915 was also “adjusted” more than 40 times over the 10-year period from May 2008 to January 2018. Again, there were both positive and negative “adjustments” made to the calculated anomaly. However, in this case, the net result was a decrease of 0.005oC, or only a 4% reduction from the earliest anomaly value shown. It is interesting to note that the calculated anomaly was reduced by as much as 0.065oC during the period, before being increased again in June 2015.
There is no obvious explanation for the apparent need to retrospectively “re-adjust” the temperature anomaly calculations this frequently, or to this extent. The “adjustments” are all in the second decimal place, which means that they are all made at a greater level of “precision” than the underlying measurements.
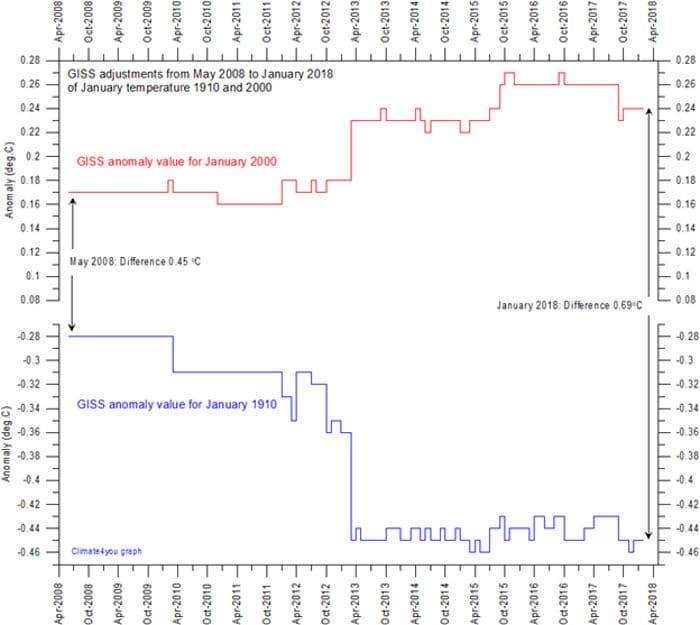
The graph below illustrates similar retrospective temperature anomaly adjustments made by NASA GISS.

In the January 2000 case, while there are both positive and negative “adjustments”, the net result is again a positive adjustment of 0.07oC. However, in this case, that “adjustment” represents an increase of approximately 40% from the earliest anomaly value shown in the graph. It is important to note that NCDC “adjusts” the temperature measurements before providing them to NASA GISS, which then “re-adjusts” them. The GISS “re-adjustment”, in this case, results in a first anomaly value 0.10oC lower than the anomaly value provided to GISS by NCDC; and, thus, a lower final anomaly value as well.
In the January 1910 case, again there are both positive and negative “adjustments”, but the net result is a negative “adjustment” of 0.17oC. Note that both the January 2000 and the January 1910 values are “re-adjusted” less frequently by NASA GISS than by NCDC.
Both in the case of NCDC and NASA GISS, the net effect of these “re-adjustments” is to increase the temperature anomaly change from the earlier month in 1915 or 1910 to the anomaly in January 2000. In the case of NCDC, the anomaly increase is 0.08oC. In the case of GISS, the anomaly increase is 0.24oC, or three times the anomaly increase calculated by NCDC. It is also important to note that these changes only reflect the period from 2008 to 2018. There is no corresponding record of “adjustments” made prior to 2008 available from climate4you.com. However, there is little reason to believe that the “adjustments” shown in the graph above were the first “adjustments” made to these anomalies, or that they will be the last.
It is possible that one of the anomaly values shown in each graph line is accurate, but it is certainly not possible that all of the values are accurate; and, it is not certain that any of the values are accurate.