
The consensed climate science community has argued that previous climate warming and cooling events were the result of natural variability, but that the recent warming is the result of increased anthropogenic CO2 concentrations in the atmosphere. They provide no support for the idea that natural variability has ceased, or at least greatly diminished, nor do they provide any proof that the recent warming is CO2 driven.
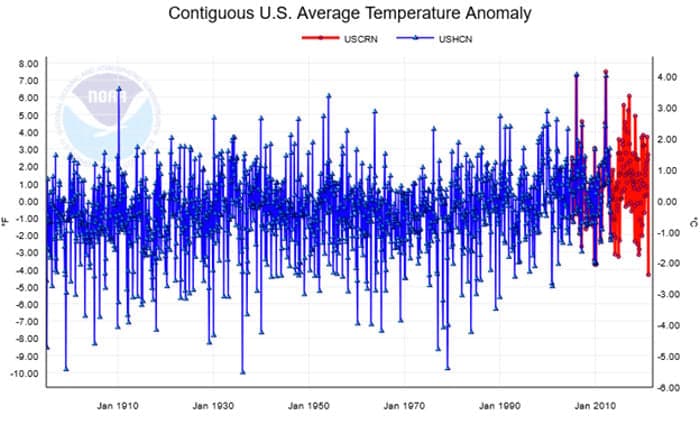
The graph below illustrates the measure US average temperature anomaly over the period 1880-2020. The temperature trend in the data corresponds to the ~1°C increase in the global average temperature anomaly over the same period, suggesting that the US has experienced average warming very similar to the global average warming.

The year 1950 is the year typically associated with the global warming driven by increasing anthropogenic CO2 concentrations. However, the trend in the anomaly data graphed above shows a temperature anomaly decline over the period from 1940-1970, followed by a temperature anomaly increase from 1970-2020. Note that the data graphed in blue above, from the US Historical Climatology Network, has been “adjusted”, while the data graphed in red, from the US Climate reference Network, is unadjusted or raw data. The USCRN uses remotely located, high accuracy and high precision measuring instruments, which are cross calibrated to detect instrument drift or failure.
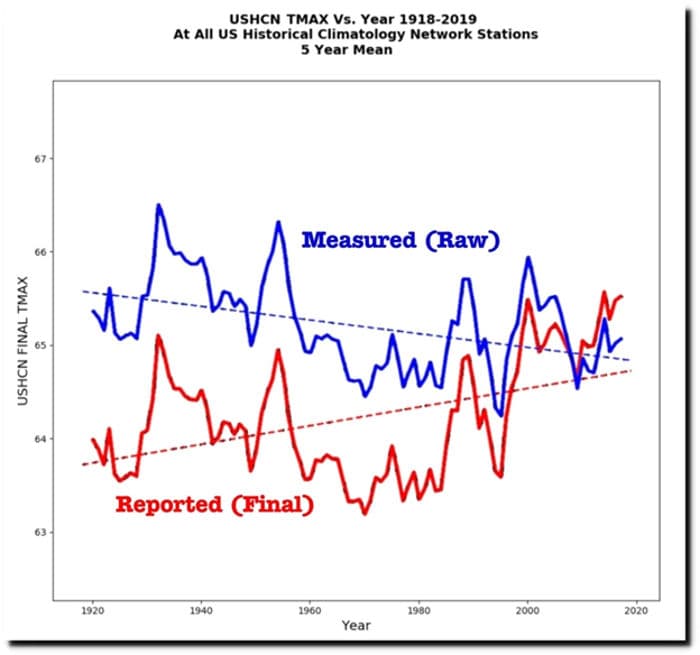
The “adjusted” USHCN anomaly data match the unadjusted USCRN anomaly data over the period when the plotted data overlap. However, the earlier USHCN anomaly data have been affected by “unnatural variation”, as shown in the graph below produced by Tony Heller.

Note that the overall magnitude of the “adjustments” over the period shown is approximately 1.5°F (~1°C), or approximately all the recent warming attributed to increased atmospheric CO2 concentrations. The “adjustments” primarily cool the past, prior to the existence of the USCRN, which provides a high accuracy, high precision reference in the period after 2005 for the US anomaly data. The “adjustments” make the rate of increase of the temperature anomaly appear to be larger and essentially reverse the cooling trend apparent in the measured data. There is no global reference to constrain the “adjustments to non-US data and no possible reference for anomalies “infilled” where no data exists.
The first graph above clearly illustrates the magnitude of natural variability in the temperature anomalies, which ranges from approximately +4.2°C to -5.5°C, or approximately ten times the trend of the warming anomalies over the period. These anomalies do not include any seasonality, since the anomalies are the deviation from the same months in the 30-year climate reference period.
The variation in the anomalies is largely driven by longer term weather events, such as El Nino and La Nina, and by climate events such as the Pacific Decadal Oscillation and the Atlantic Multidecadal Oscillation.
The fact that global temperature anomaly data have been subjected to “adjustment” over a period of more than 100 years raises serious questions about the validity of the reported warming anomaly and the entire anthropogenic climate change narrative.