tipping point: the critical point in a situation, process, or system beyond which a significant and often unstoppable effect or change takes place
There has been much discussion regarding potential future climate “tipping points”, particularly among climate change alarmists, but also among some members of the consensed climate science community. The typical concern is that some combination of higher atmospheric GHG concentrations and positive water vapor feedback might trigger a rapid and uncontrollable rise in global average surface temperatures.
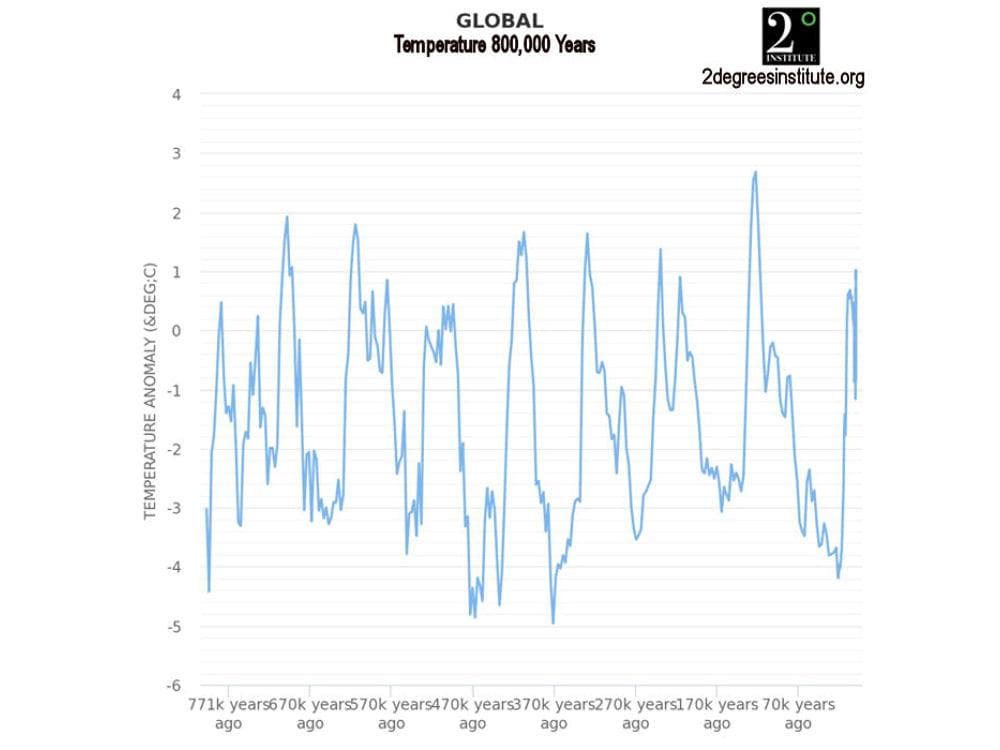
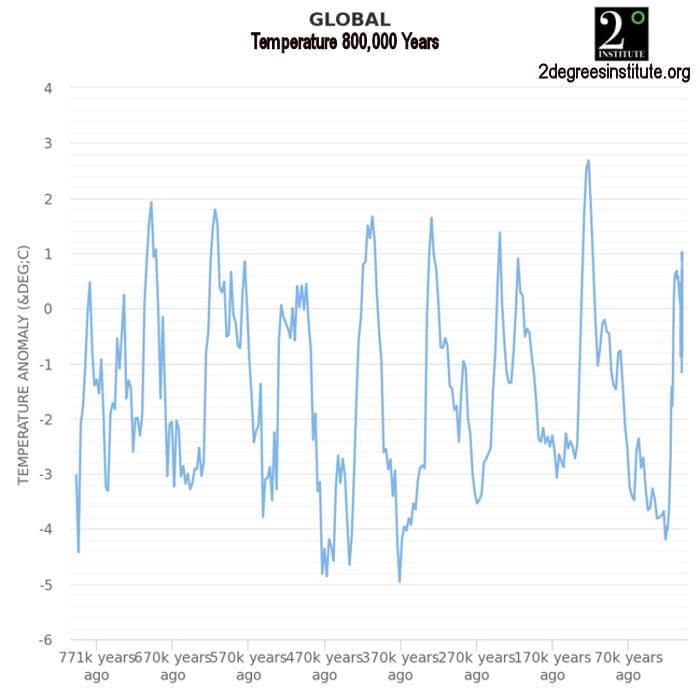
Earth has experienced numerous and largely regular “tipping points” throughout history according to numerous paleoclimatic reconstructions. The graph below is a temperature anomaly history reconstruction over the past approximately 800,000 years. An interactive version of this graph is available here. Note that the temperature anomalies and time periods shown are not as precise as indicated when selecting points on the graph because of the limitations of the various proxy records on which the graph is based.

The important message in the graph above is that the earth has experienced a major tipping point approximately every 50,000 years. Temperature anomalies have risen approximately 0.5 – 2.7°C before encountering a tipping point, from which the anomalies dropped by approximately 4 - 6.6°C. Note also that the selection of the zero level from which the anomalies are measured is somewhat arbitrary because of the limitations of the climatological reconstruction.
According to this reconstruction, earth has cycled over a temperature range of approximately 7.7°C over a period of approximately 800,000 years while experiencing approximately 16 major tipping points and many more minor tipping points. The selected zero level suggests that the negative deviations from the zero level have been approximately twice as large as the positive deviations and that the duration of the negative deviations has been approximately 5 times as long as the duration of the positive deviations.
The maximum positive temperature anomaly approximately 120,000 years ago was approximately 2.7°C, or approximately 2.5 times the current global average temperature anomaly and approximately 0.7°C above the original target anomaly established in the Paris Accords.
The change in the temperature anomalies after each of the major positive and negative tipping points has differed significantly over the 16 tipping points. In general, the anomaly increases from the negative tipping points points have been sharper and more rapid than the declines from the positive tipping points. The duration of each of the positive tipping points has been far shorter than the duration of the negative tipping points.
The important points here are that the earth has experienced numerous tipping points in the past, but in the process has varied within a relatively narrow range of temperature anomalies. Each of these tipping points occurred without anthropogenic intervention and was strictly a function of natural variation. The numerous minor tipping points over the period suggest the prior occurrence of modest temperature excursions similar to the Roman Warm Period, the Medieval Warm Period and the Little Ice Age.
This 800,000 year history of temperature anomaly fluctuation suggests that the natural variation which has occurred over this period is likely to exist today and to persist in the future.