
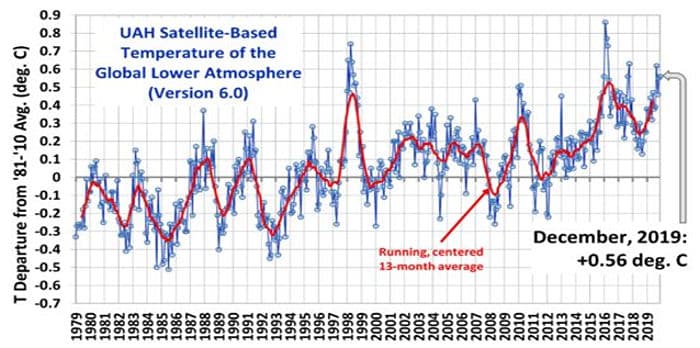
The graph below from Dr. Roy Spencer’s website shows the entire history of the UAH satellite temperature anomaly record, which began in 1979. The anomaly has increased at a relatively consistent rate of 0.13°C per decade over the 40-year period, though there have been rapid and large short-term deviations from this trend.

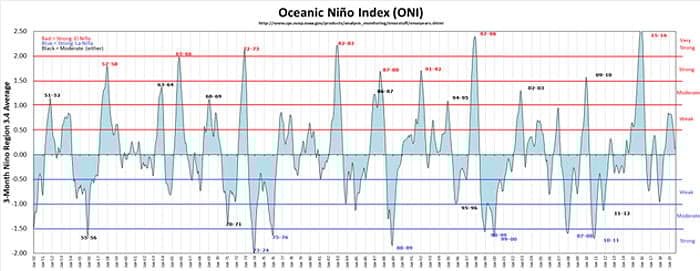
The graph below from the ggweather.com website shows the history of the ENSO phenomenon since 1950. The dark blue arrow on the graph marks the start of the UAH satellite temperature anomaly record.

Several significant messages emerge from these graphs. Comparison of the graphs illustrates the influence of ENSO on global average temperatures, particularly the super El Ninos in 1997/1998 and 2015/2016, but also the weaker 2009/2010 and 2018/2019 El Ninos, as well as the strong La Ninas of 1988/1989, 1998/1999, 1999/2000, 2007/2008 and 2010/2011. These El Nino events produced increases in global average temperature anomalies of as much as 1°C (1997/1998) in a few months, or at as much as 20 times the decadal trend rate. Note that there was no strong La Nina after the 2018/2019 super El Nino. ENSO clearly illustrates he strong impacts of natural variation on global climate.
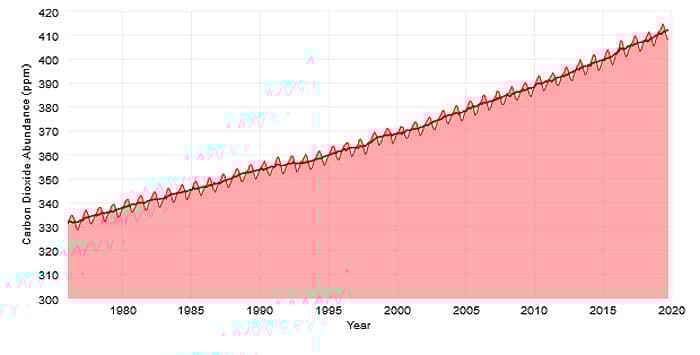
The UAH graph also illustrates that global warming has been occurring at a relatively constant rate over the satellite period, showing no significant acceleration despite continual increases in atmospheric CO2 concentrations over the period. The graph below from the climate.gov website shows that atmospheric CO2 concentrations have increased approximately 80 ppmv over the period from 1975-2019, approximately 1.8 ppmv per year. This rate would indicate a doubling of atmospheric CO2 concentration from the pre-industrial level of approximately 270 ppm in 1950 to approximately 540 ppmv in 2100.

Assuming the rate of increase of the UAH temperature anomaly continues at the rate of approximately 0.13°C per decade, the UAH temperature anomaly would increase by approximately 1.04°C through 2100, or to approximately 1.6°C above the 1981-2010 climate reference period. This would place the increase at the low end of the range of climate sensitivity estimated by the IPCC and used in the climate models. This result would be consistent with numerous recent estimates of climate sensitivity.
There is no support in these numbers for a “climate crisis” or a “climate emergency”. There are no climate “tipping points” in the picture. These numbers do indicate that the total temperature anomaly increase through 2100 will be very close to the 2°C target set by the UNFCCC, assuming current trends continue. Should the rate of growth of global annual CO2 emissions stabilize, or begin to decline, as the result of increased national “ambition” in response to the Paris Accords, the expected temperature anomaly increase through 2100 could be somewhat less than 2°C and perhaps even approach the 1.5°C revised target established after COP21 in Paris.