

U.S. EPA--https://www.nsf.gov/news/mmg/mmg_disp.jsp?med_id=75857&from=mn
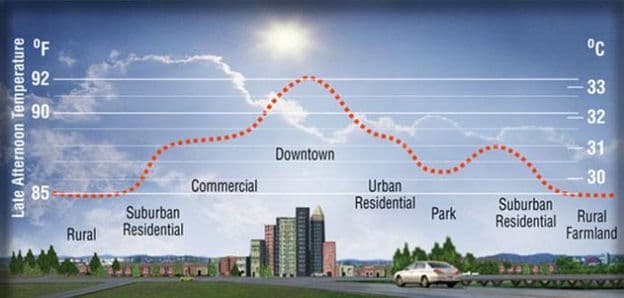
The above graphic from Lawrence Berkeley National Laboratories (U.S. EPA) clearly illustrates one aspect of the Urban Heat Island (UHI) effect – the impact of urbanization on late afternoon temperatures. The graphic depicts a 7oF elevation of downtown temperature relative to the temperatures in surrounding rural areas. This temperature elevation is the result of multiple factors, including decreased albedo, localized heat emissions, and wind blocking.
The UHI effect also manifests as warmer nighttime temperatures, primarily as the result of heat retention in downtown buildings and roads, combined with wind blocking. The nighttime warming can significantly exceed the daytime effect.
The UHI effect is clearly anthropogenic, though it is not the result of increased CO2 concentrations in the atmosphere. Human construction of cities, towns and villages, commercial areas and industrial parks has an obvious impact on the local climate, though a far lesser impact on global climate, since cities occupy on approximately 3% of global land area.
Numerous groups are involved in efforts to slow or halt urban sprawl. However, as the above graphic indicates, increased population density drives the UHI effect. It would be reasonable to expect that further increasing population density would cause the temperature difference between downtown areas and the surrounding rural areas to increase.
The graphic does not include an airport, though most larger cities are served by one or more airports. This is a significant omission from a climatological standpoint, since approximately half of all measuring stations in the Global Historical Climatology Network (GHCN) are located at airports. While airports are not affected by wind blocking to the same extent as the downtown areas in cities, they are affected by both decreased albedo and localized heat emissions. The primary purpose of the Automated Weather Observing System (AWOS), the Automated Surface Observing System (ASOS), and the Automated Weather Sensor System (AWSS) at airports is to provide local weather information in the interests of safe and efficient aviation operations. One of the primary aviation concerns is maximum temperature, since it affects both aircraft engine thrust and aerodynamic lift of the wing surfaces.
These automated airport weather stations are being used increasingly for climate related data acquisition because they are available and are well maintained. However, they are not ideally located for climatological measurement purposes.
Climate Reference Network Rating Guide - adopted from NCDC Climate Reference Network Handbook, 2002, specifications for siting (section 2.2.1) of NOAA's new Climate Reference Network:
Class 1 (CRN1)- Flat and horizontal ground surrounded by a clear surface with a slope below 1/3 (<19deg). Grass/low vegetation ground cover <10 centimeters high. Sensors located at least 100 meters from artificial heating or reflecting surfaces, such as buildings, concrete surfaces, and parking lots. Far from large bodies of water, except if it is representative of the area, and then located at least 100 meters away. No shading when the sun elevation >3 degrees.
Class 2 (CRN2) - Same as Class 1 with the following differences. Surrounding Vegetation <25 centimeters. No artificial heating sources within 30m. No shading for a sun elevation >5deg.
Class 3 (CRN3) (error >=1C) - Same as Class 2, except no artificial heating sources within 10 meters.
Class 4 (CRN4) (error >= 2C) - Artificial heating sources <10 meters.
Class 5 (CRN5) (error >= 5C) - Temperature sensor located next to/above an artificial heating source, such a building, roof top, parking lot, or concrete surface."
These airport weather stations offer the advantages of state-of-the-art measuring instruments, continuous measurement and frequent recalibration. However, they require “adjustment” of the data for climatological purposes, to reduce or eliminate the effects of the surrounding buildings, runways, taxiways and aircraft engine exhaust.
When assessing the validity of climatological temperature measurements, it is important to ask one simple question: “Where is the measuring station?” The answer affects the validity of both the maximum and minimum temperature measurements.