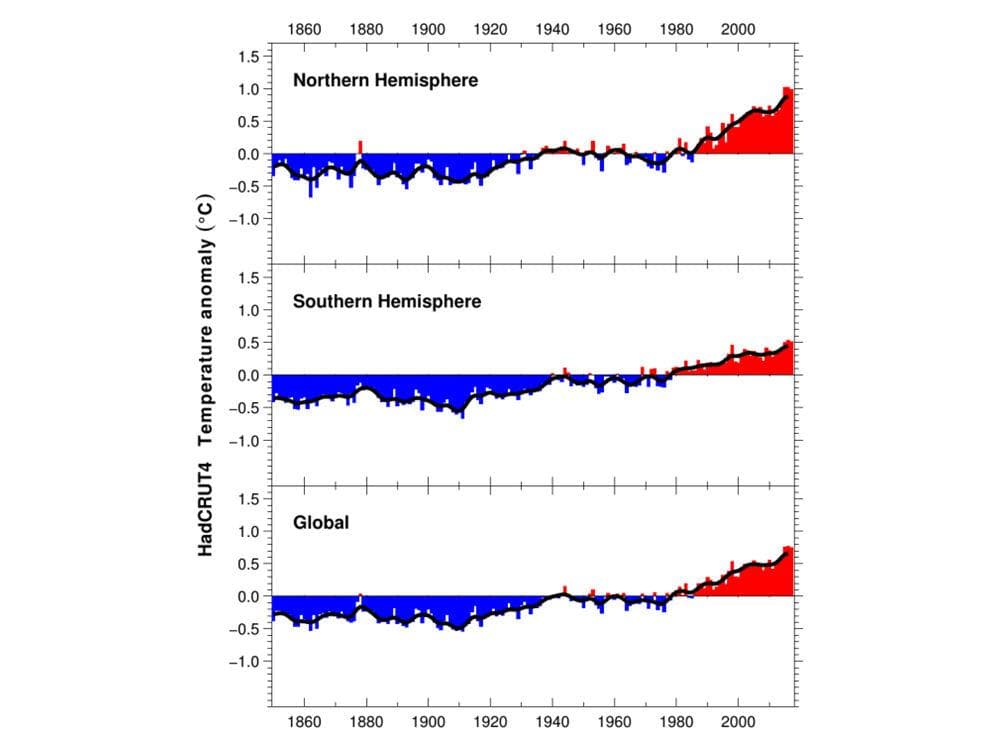
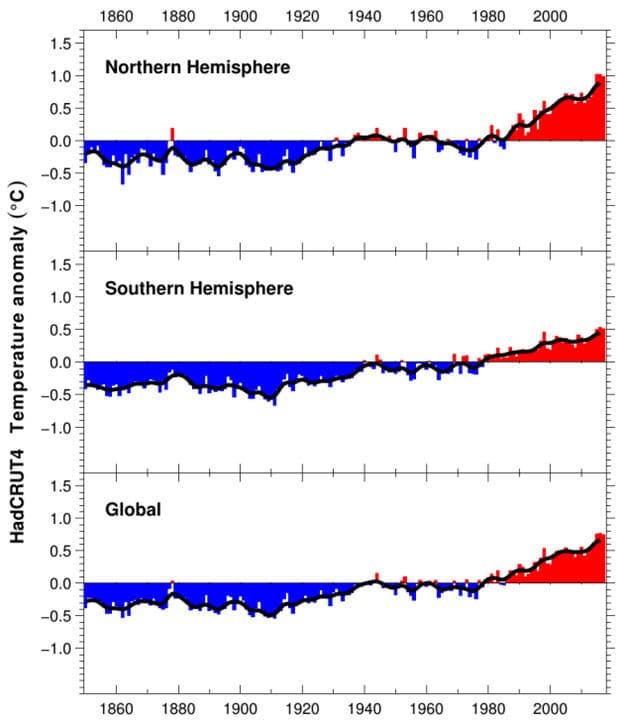
The graph below shows the HadCRUT4 Northern Hemisphere, Southern Hemisphere and Global temperature history for the period of the instrumental temperature record from 1850 to the present.

The global average temperature anomaly has varied from approximately -0.3oC to approximately 0.7oC over the period, relative to the HadCRUT 1961-1990 reference period, or a total variation of approximately 1.0oC, on an annual basis. The variation has been greater in the Northern Hemisphere (~1.1oC) than in the Southern Hemisphere (~0.8oC), largely because the Northern Hemisphere has a larger land area, which changes temperature more rapidly than the sea area.
In a recent blog entry at the Real Climate web site, Dr. Gavin A. Schmidt, Director of the NASA Goddard Institute of Space Studies, made the following observation regarding absolute temperatures and temperature anomalies.
“But think about what happens when we try and estimate the absolute global mean temperature for, say, 2016. The climatology for 1981-2010 is 287.4±0.5K, and the anomaly for 2016 is (from GISTEMP w.r.t. that baseline) 0.56±0.05ºC. So our estimate for the absolute value is (using the first rule shown above) 287.96±0.502K, and then using the second, that reduces to 288.0±0.5K. The same approach for 2015 gives 287.8±0.5K, and for 2014 it is 287.7±0.5K. All of which appear to be the same within the uncertainty. Thus we lose the ability to judge which year was the warmest if we only look at the absolute numbers.” (emphasis mine)
Absolute zero Kelvin is -273.15oC, so 287.4oK is 14.25oC (~57.6oF). According to Dr. Schmidt, this temperature is known to +/-0.5oC (+/-0.9oF).
The HadCRUT anomaly data show a total variation in global average temperature of approximately 1.0oC over the period from 1850-2016, which is approximately equal to the confidence range (+/-0.5oC) asserted by Dr. Schmidt for the absolute value of global average temperature. Therefore, the absolute value of the global average temperature is approximately 14.5oC+/-0.5oC over the period; and, the change in that absolute value over the period is of questionable statistical significance. That is a far cry from unprecedented warming.
Dr. Schmidt expresses the anomaly value, in the observation quoted above, to two decimal place precision, as is common in climate science. However, the anomalies are not measured at this level of precision. Rather, the measurements are made to a single decimal place and then “adjusted”. The additional decimal place results from application of the Law of Large Numbers. However, in the case of global temperature anomaly values, the application of this statistical principle is questionable, since the numerical values used to calculate the anomalies have been “adjusted” and, thus, any errors in the numbers should not be considered random.