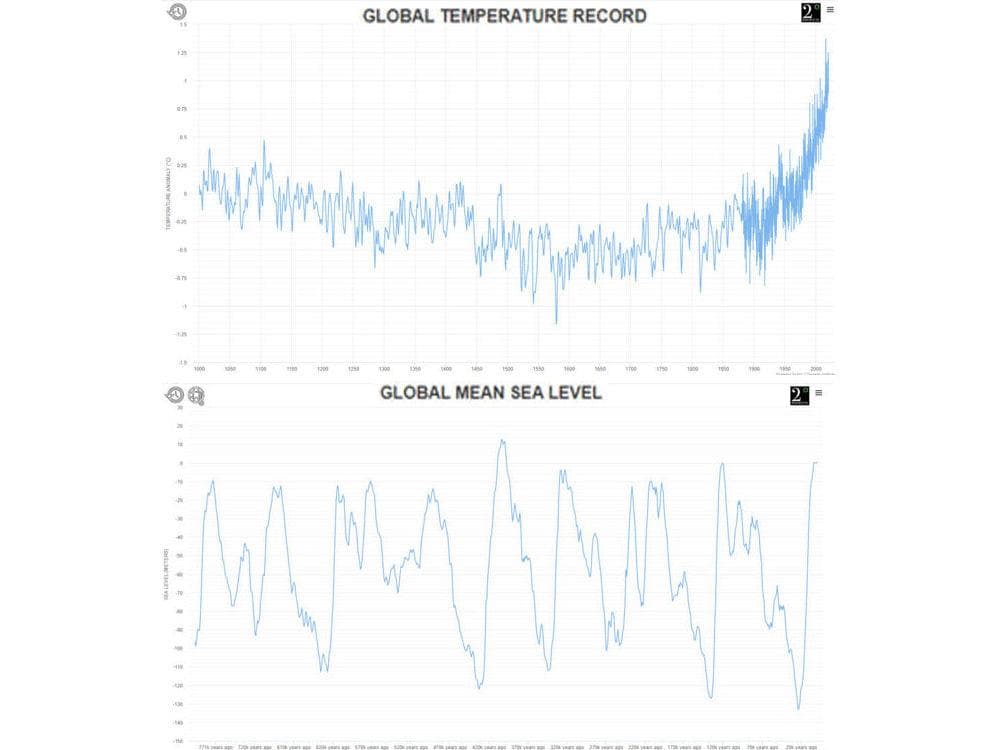
The previous commentaries on coincidence and causation regarding temperature anomalies and sea level referred to two interactive composite graphs (here and here). These graphs each combine paleoclimatic estimates of historical conditions with “adjusted” data from the instrumental records. The graphs present both the paleoclimatic reconstructions and the “adjusted” instrumental data to two decimal place precision. This level of precision is unrealistic for the “adjusted” instrumental data and completely unreasonable for the paleoclimatic reconstructions.
The currently reported global average near-surface temperature anomalies are calculated from datasets which have been “adjusted” to reduce perceived inaccuracies in the original data; and, in some cases, have had temperature estimates “infilled” where real instrumental data do not exist. Most of the instrumental data is measured to one decimal place and the adjustments are made in that one decimal place. Therefore, the number in the first decimal place in the original data is an estimate in the “adjusted” temperature record and any number in the second decimal place is the result of an averaging calculation. The Law of Large Numbers legitimizes such calculations in the errors in the numbers are random, an unreasonable assumption regarding “adjusted” temperatures.
The datasets are not truly global since there are no instrumented sites in many locations. This is particularly true regarding sea surface temperatures, where the instrumentation is far less extensive than on land. The sea surface temperature measurements still include measurements taken by ships, using a variety of measurement protocols, though these are largely being replaced by data from purpose-designed buoys.
The currently reported sea level anomalies are calculated both from a limited number of coastal tide gauges and from satellites. The tide gauge data are confounded by changes in elevation of the measuring instruments due to isostatic rebound and land subsidence. The satellites currently measure changes in sea level approximately twice the values measured by the tide gauges. With this large, unresolved difference in instrumented measurements, it is not realistic to report sea level during the instrumental period to two decimal place precision, since the difference exists to the left of the decimal point.
Composite graphs such as those linked above join the paleoclimatic portion of the curve to the instrumental portion of the curve at a point, indicating a smooth transition from one to the other. Such graphs do not continue to show the values which the paleoclimatic analysis would have produced had it been continued beyond the beginning of the instrumental record, so it is not possible to compare the results of the two methods. One example of the problems this issue can cause is what Professor Phillip Jones of the University of East Anglia described as “Mike’s Nature Trick”, referring to Professor Michael Mann’s decision to transition from the paleoclimatic portion of his “hockey stick” graph to “adjusted” instrumental data at the point at which the paleoclimatic temperatures began to decline while the instrumental temperatures were increasing. The difference in the direction of temperature change between the two diverse sources from that point calls into question the validity of the analysis.