
In my commentary “Emissions or Equity”, I discussed the philosophical issues regarding global “greenhouse gas” emissions reductions. Now let’s look at the numbers.
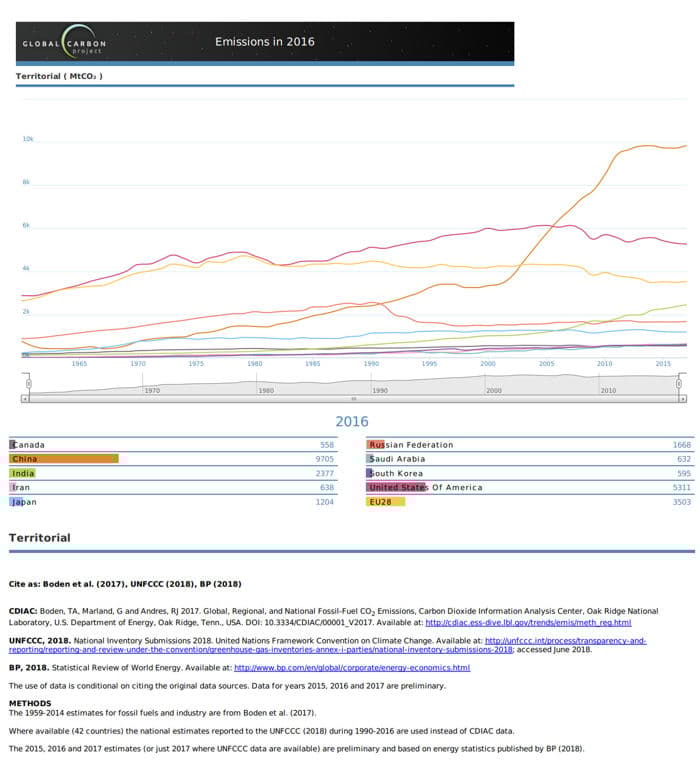
The graph below shows the trends in global emissions for the major emitters through 2016. (NOTE: The version of the graph at the linked source is interactive.) Emissions grew by 1.6% in 2017 and are expected to have grown by approximately 2.7% in 2018.

The emissions of these nations are generally stable to down, with the exception of China and India. China’s emissions have increased by a factor of approximately 3 in the 21st century, while India’s emissions have increased by a factor of approximately 2.5. China’s emissions stagnated after 2010 as a result of an economic slowdown but have now resumed their growth.
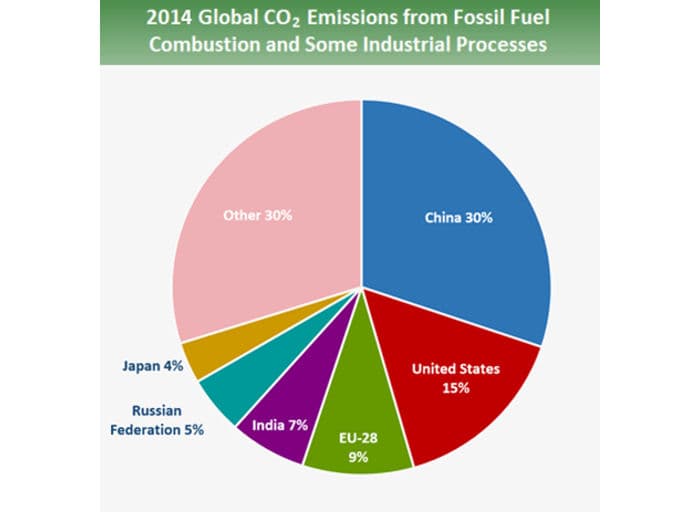
The chart below illustrates the percentage of annual emissions in 2014 by country. As shown in the graph above, only India’s emissions continued to grow significantly in 2015 and 2016. US emissions resumed their growth in 2017 and 2018 at approximately 2.5%. China’s emissions also returned to approximately 5% growth, while India’s emissions continued their approximately 6 - 7% growth.

China’s annual emissions are now approximately twice US emissions and are greater than the emissions of the US and the EU combined. China made no commitment to reduce its CO2 emissions as part of the Paris Accords, but rather indicated a willingness to begin reducing emissions after 2030. India took a similar approach to the Paris Accords.
The ten-year time horizon proposed in the “Green New Deal” (GND) for achieving net-zero emissions in the US economy would approximately offset the projected growth of China’s emissions over the same period, thus resulting in no net reduction in global annual emissions. Assuming continuation of India’s annual emissions growth, global annual emissions would continue to increase at a rate of 0.5% per year, depending on the changes in emissions rates among the remaining nations of the globe. Therefore, it appears highly unlikely that global annual emissions would begin to decrease prior to 2030, absent heroic efforts on the part of nations other than the US; and, it appears virtually impossible if the US does not adopt the GND, which also appears highly unlikely.
Adoption of the GND in the US would likely cause significant industrial relocations to nations such as China and India, which have no such plans to reduce emissions prior to 2030; and, no clear plans to begin reducing emissions at that time. Such industrial relocation would likely increase the emissions growth rates in China, India and other nations with no firm emissions reduction plans. This would further add to the increasing emissions rates through 2030.
Adoption of the GND in the US, with its estimated total cost of approximately $100 trillion would also seriously limit the ability of future US administrations to make the expected contributions to the US Green Climate Fund, thus limiting the funds available for renewable energy development in the developing and not-yet-developing nations.
“The problem with socialism is that you eventually run out of other people’s money.” Lady Margaret Thatcher