
Energy Policy

The incandescent lightbulb is now outlawed.[1] This fact is a perfect metaphor for “energy policy.” Should it be illegal in the United States to manufacture, sell, buy, and use a traditional incandescent light bulb? Your informed answer to that question will provide deep insight into your views on hundreds of other energy policy questions. (BTW, my answer is no, but I bet you guessed that.)
Energy is the lifeblood of our economy; it touches your life in a hundred ways each day. Yet energy policy--the set of government rules and regulations that prescribe how energy is produced, delivered, and consumed--is a complex and even a chaotic subject.
Energy was an uninteresting subject for the average person prior to the OPEC Oil Embargo in 1973. Oil prices had been stable at about $20 a barrel in real terms for nearly a century and electricity prices had declined from about 22 cents per kilowatt to about 13 cents from 1960 to 1973, even as consumption of electricity quadrupled from 1950 to 1973, as more and more homes and appliances used electricity and utilities became better at building large coal and nuclear plants.
But the OPEC Embargo changed everything about energy and energy policy. Four points will illustrate this importance.
- President Jimmy Carter’s presidency (1976 to 1980) was dominated by energy issues which he characterized as the “moral equivalent of war.”
- A little more than two decades later a California governor was recalled because he botched an electricity crisis in California and Arnold Schwarzenegger was elected Governor.
- There is a widespread perception that the US has gone to war in the Middle East over oil issues.
- The Pope of all people has recently declared war on climate change, most of which is laid at the feet of fossil energy.
Part of the complication in energy policy is that it must be addressed on many fronts; international, national, State, and local governments all have a role in stirring the pot.
Many books and articles are written on very specific aspects of energy policy but most are written for other experts. Surprisingly, few are written that cover the broad landscape of energy policy. Even fewer of these writings take a strong market-oriented perspective; the vast majority take an interventionist approach largely for environmental and oil import reasons. And none that I have found are addressed to the pro-market political activist who has a real job during the day and then tries to save the country in his or her spare time. This discussion is for that heroic citizen, The Forgotten Man.
So what’s the bottom line on energy policy?
- First, we make energy policy much more difficult than it has to be. Energy is a commodity just like wheat or cars or hamburgers. Mostly, we rely on competitive markets in each of these other commodity industries to make sure that we have an adequate supply to meet the consumers’ needs at reasonable prices. But we treat energy differently. I venture to guess that there are only a few industries more affected by government intervention than energy. Why is that? Does that mean we benefit from that intervention? Is there a better way? The article explores these questions.
- Second, right now energy policy is being driven by climate change. Even if one is sympathetic to some of the claims made about climate change, many stupid actions are being taken in its name that has profoundly negative effects on energy markets.
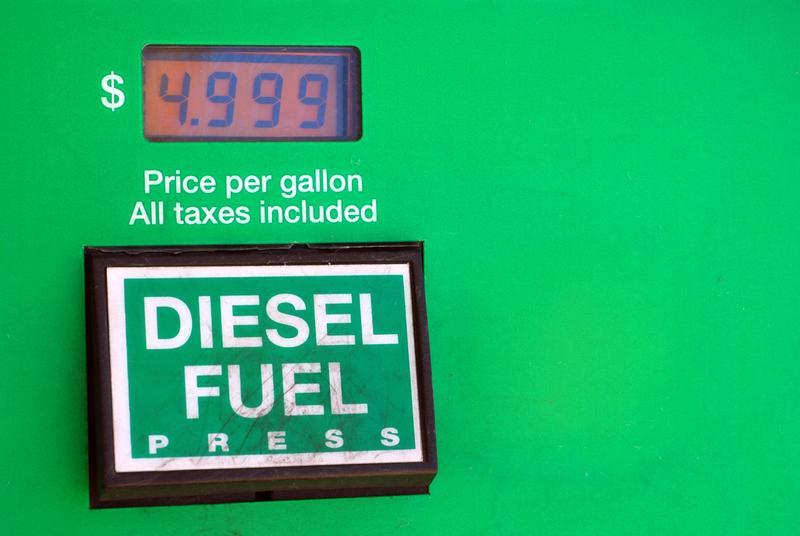
- Third, oil issues get the most attention but we do not face any real danger in oil markets. Oil trades in global markets and while there may be price fluctuations (as I write, oil is about $35 a barrel, having been over $100 in the recent past), we will never face a situation where we run out of oil. Most countries with plentiful oil have built their economies on oil revenue and the recent drop in oil prices has created serious political problems for these countries. They simply can’t afford not to produce oil. But problems in oil markets can result in unnecessarily higher prices and thus we need to pay some attention to them in order to promote prosperity.
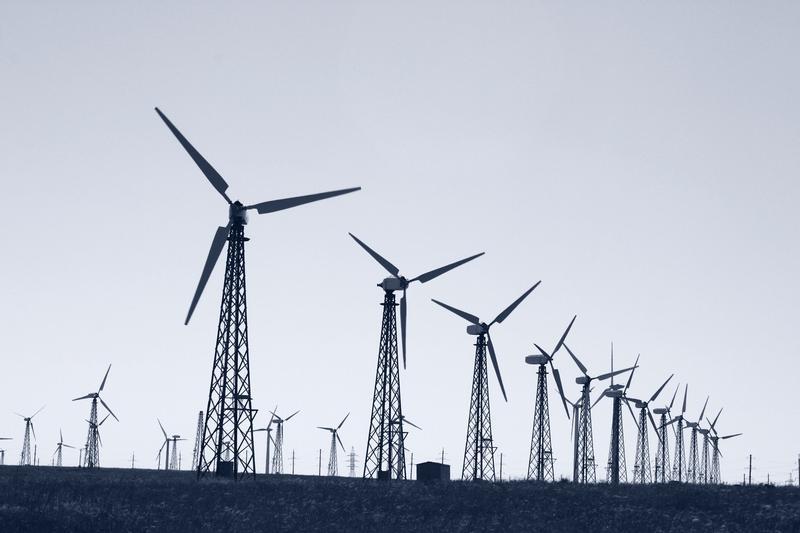
- Fourth and most important, electricity faces real problems that could result in catastrophic failure of the system, thus threatening not only prosperity but human life. The major framework for electric policy was set in 1935. That framework worked fine up to the OPEC Embargo. Electricity can compete against oil and natural gas in many applications. Thus adjustments were necessary to the historical framework after the Embargo. But policymakers have only nibbled at the edges of electricity policy and have not fundamentally changed the 1935 framework. Yet little more than additional tinkering is being done to promote an electricity industry for the 21st Century. Many special interests are pushing and pulling on the antiquated framework for personal gain but few are fundamentally committed to a complete rethinking of the role of the electric system of the future, especially given the increasing digitalization of our economy. And as noted above, unsound policies on climate change make electric issues even more difficult.
[1] This is a good place to make a point. Some pointy headed academics will disagree with even this first sentence. Technically, Congress did not “ban” incandescent bulbs in the Energy Independence and Security Act of 2007. Rather, they set a standard that most, if not all, traditional incandescent bulbs could not achieve and established a schedule for light bulbs of different wattages to meet this standard. So it is fair to say that Congress outlawed incandescent bulbs. But since the accompanying Article is a synthesis of the broad topic of “energy policy” it would needlessly clutter and complicate the text to be “technically” accurate in every instance. The size of the document would need to double and the reader would understand less of the essence of energy policy if I did not make some broad generalizations. Nonetheless, I am sure I will receive some criticism that many of my statements are not “technically correct.” I hope that making this point early in the article will allow for a better understanding of the content of the Article.
Energy Policy News
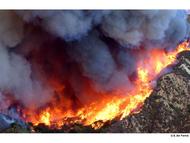
California Wildfire Lawfare - ORIGINAL CONTENT
- 3/17/25 at 06:00 AM
POLICY BRIEF: American Energy Blueprint - Highlighted Article
- 3/14/25 at 06:00 AM

Endangerment Unfound - ORIGINAL CONTENT
- 3/10/25 at 06:00 AM

How the Green Energy Narrative confuses things - Highlighted Article
- 3/7/25 at 06:00 AM

International Lawfare - ORIGINAL CONTENT
- 3/3/25 at 06:00 AM

What President Trump’s Energy Plan Means for the State Regulatory Environment, the Generation Mix and Electric Transmission - Highlighted Article
- 2/28/25 at 06:00 AM

Cautionary Tales - ORIGINAL CONTENT
- 2/24/25 at 06:00 AM

From Idealism to Realism - Highlighted Article
- 2/21/25 at 06:00 AM

All Goal and No Plan - ORIGINAL CONTENT
- 2/17/25 at 06:00 AM

Energy, Climate & Freedom - ORIGINAL CONTENT
- 2/10/25 at 06:00 AM
People Are Catching On To The Truth - Highlighted Article
- 1/31/25 at 06:00 AM

Climate Policy Priorities 2025 - ORIGINAL CONTENT
- 1/27/25 at 06:00 AM

The True Cost of Wind Energy - Updated - Highlighted Article
- 1/24/25 at 06:00 AM
The Changing of the Guard - ORIGINAL CONTENT
- 1/20/25 at 06:00 AM

-
Headlines
Search Headlines-
Samizdat: Investors shaken as Tice torpedoes Clean Power 2030
- Net Zero Watch
- July 18, 2025
-
CounterPunch is (Partially) Right: Carbon Capture and Storage is a Scam
- Climate Realism
- July 17, 2025
-
Biggest U.S. Grid Operator Issues Alert for July 16
- OilPrice.com
- July 16, 2025
-
Ed Miliband to unleash new gas plants to back up patchy wind and solar
- Not A Lot Of People Know That
- July 16, 2025
-
Shuttered Nuclear Plant On Verge Of Revival As America’s Grid Buckles
- Daily Caller
- July 15, 2025
-
Netherlands RATIONS electricity as country struggles to cope with turning away from gas as part of green policies - as expert warns Britain is also 'in trouble'
- Daily Mail
- July 14, 2025
-
Zuckerberg "Focused" On Building Mega Gigawatt-Size Data Centers
- ZeroHedge
- July 14, 2025
-
-
Scholars Wanted
 The Right Insight is looking for writers who are qualified in our content areas.
