Call or complete the form to contact us for details and to book directly with us
435-425-3414
435-691-4384
888-854-5871 (Toll-free USA)


Contact Owner

*Name
*Email
Phone
Comment
 
Skip to Primary Navigation Skip to Primary Content Skip to Footer Navigation

In the Wake of the News

Emissions by the Numbers

In my commentary “Emissions or Equity”, I discussed the philosophical issues regarding global “greenhouse gas” emissions reductions. Now let’s look at the numbers.

The graph below shows the trends in global emissions for the major emitters through 2016. (NOTE: The version of the graph at the linked source is interactive.) Emissions grew by 1.6% in 2017 and are expected to have grown by approximately 2.7% in 2018.

Global Emissions

The emissions of these nations are generally stable to down, with the exception of China and India. China’s emissions have increased by a factor of approximately 3 in the 21st century, while India’s emissions have increased by a factor of approximately 2.5. China’s emissions stagnated after 2010 as a result of an economic slowdown but have now resumed their growth.

The chart below illustrates the percentage of annual emissions in 2014 by country. As shown in the graph above, only India’s emissions continued to grow significantly in 2015 and 2016. US emissions resumed their growth in 2017 and 2018 at approximately 2.5%. China’s emissions also returned to approximately 5% growth, while India’s emissions continued their approximately 6 - 7% growth.


2014 Global CO2 Emissions


China’s annual emissions are now approximately twice US emissions and are greater than the emissions of the US and the EU combined. China made no commitment to reduce its CO2 emissions as part of the Paris Accords, but rather indicated a willingness to begin reducing emissions after 2030. India took a similar approach to the Paris Accords.

The ten-year time horizon proposed in the “Green New Deal” (GND) for achieving net-zero emissions in the US economy would approximately offset the projected growth of China’s emissions over the same period, thus resulting in no net reduction in global annual emissions. Assuming continuation of India’s annual emissions growth, global annual emissions would continue to increase at a rate of 0.5% per year, depending on the changes in emissions rates among the remaining nations of the globe. Therefore, it appears highly unlikely that global annual emissions would begin to decrease prior to 2030, absent heroic efforts on the part of nations other than the US; and, it appears virtually impossible if the US does not adopt the GND, which also appears highly unlikely.

Adoption of the GND in the US would likely cause significant industrial relocations to nations such as China and India, which have no such plans to reduce emissions prior to 2030; and, no clear plans to begin reducing emissions at that time. Such industrial relocation would likely increase the emissions growth rates in China, India and other nations with no firm emissions reduction plans. This would further add to the increasing emissions rates through 2030.

Adoption of the GND in the US, with its estimated total cost of approximately $100 trillion would also seriously limit the ability of future US administrations to make the expected contributions to the US Green Climate Fund, thus limiting the funds available for renewable energy development in the developing and not-yet-developing nations.

“The problem with socialism is that you eventually run out of other people’s money.” Lady Margaret Thatcher


Tags: CO2 Emissions, Greenhouse Gas

Highlighted Article: Climate Change Misconceived


From: Watts Up With That?

By: Iain Aitken

Date: May 6, 2019


Climate Change Misconceived


"In this essay I propose that there are many things about climate change that the general public, journalists, academics, environmentalists and politicians may think they ‘know’ to certainly be true that are actually, at the least, highly equivocal (or demonstrably false) and that once these misconceptions are corrected perceptions of the issue are (or, at least, should be) transformed. Note that throughout I use the World Meteorological Organization (WMO) and Intergovernmental Panel on Climate Change (IPCC) definition of ‘climate change’: ‘a statistically significant variation in either the mean state of the climate or in its variability, persisting for an extended period (typically decades or longer)’. By ‘global warming’ I mean a rise in the Global Average Surface Temperature of the Earth."


Climate Change Misconceived


Tags: Highlighted Article

Emissions or Equity?

The first argument of the consensed climate science community is that global “greenhouse gas” emissions must be reduced to avoid a potential future climate catastrophe if the global average near-surface temperature increase exceeds 1.5°C or 2°C. This argument logically leads to the conclusion that all nations must stop increasing their annual “greenhouse gas” emissions and begin reducing them rapidly towards zero net annual emissions. This logic, while scientifically sound, is judged to be philosophically unsound.

The alternative argument is that developing nations and not-yet-developing nations must be allowed to continue to increase their “greenhouse gas’ emissions to support their continued economic development. The major advocates of this position are China and India, both of which have refused to agree to halt the growth of their emissions until at least 2030. This position is supported by the majority of the members of the Group of 77 developing countries.

The UN, through both the UNFCCC and the IPCC, finds itself on both sides of the issue. In the meantime, global annual “greenhouse gas” emissions continue to rise; and, therefore, global atmospheric “greenhouse gas” concentrations continue to rise as well. The increase in atmospheric “greenhouse gas” emissions cannot be halted until the reductions in emissions by numerous countries match or exceed the annual increases in emissions by numerous other countries. Correspondingly, the increase in atmospheric “greenhouse gas” concentrations cannot be halted until all nations cease adding “greenhouse gases” to the atmosphere.

Therefore, even if the US aggressively pursued the climate change aspects of the “Green New Deal” (GND), global annual atmospheric “greenhouse gas” emissions would continue to increase until the rate of decrease of emissions by the US and other countries decreasing their emissions equaled the rate of increase of emissions by developing and not-yet-developing countries increasing their annual emissions. Global annual “greenhouse gas” emissions would then stabilize and perhaps begin to decline.

However, the atmospheric concentration of “greenhouse gases” would not stabilize until all nations achieved net-zero annual emissions, which is not likely to happen until mid-century, since neither China nor India plans to cease increasing their annual emissions until at least 2030, if then. China is also providing coal generation facilities to a number of other countries, which would also continue to increase their annual emissions as their economies grow.

Of course, it is not possible to accurately estimate the ultimate “greenhouse gas” concentrations which would be reached because most nations’ commitments to reducing emissions are not firm, nor are other nations’ intentions to increase emissions. It is also not possible to accurately estimate the additional increases in the global temperature anomaly which would supposedly result from these increased emissions, since the current climate models do not accurately model the real climate.

In this atmosphere of continued uncertainty, we can expect to continue to be provided with projections of potential future scary scenarios. However, we can expect that these scenarios would be based on our progress in achieving reductions in our emissions, rather than on the lack of progress by developing and not-yet-developing nations.

It would seem that, at least in the minds of some in the consensed climate science community, climate “justice” is more important than climate catastrophe avoidance. If they prevail and we experience a climate catastrophe, at least it would be a “just” catastrophe.

Makes you feel warm all over, doesn’t it?


Tags: CO2 Emissions, Greenhouse Gas

Highlighted Article: AEI - The Green New Deal

  • 5/9/19 at 06:00 AM


From: AMERICAN ENTERPRISE INSTITUTE

By: Benjamin Zycher

April 2019

The Green New Deal

Economics and Policy Analytics

" The Green New Deal (GND) is a set of policy proposals, some more concrete than others, with the central advertised goal of ameliorating a purported climate crisis by implementing policies that would reduce US greenhouse gas (GHG) emissions to zero, or to “net zero,” by 2050 in some formulations. In addition, the GND incorporates other important social-policy goals as a means of forging a majority political coalition in support. The GND’s central premise is that such policies—either despite or by reducing sharply the economic value of some substantial part of the US resource base and the energy-producing and energyconsuming capital stock—would increase the size of the economy in real terms, increase employment, improve environmental quality, and improve distributional equity. That is a “broken windows” argument: The destruction of resources increases aggregate wealth. It is not to be taken seriously."

The Green New Deal

Economics and Policy Analytics

Tags: Highlighted Article

Climate Refugee Attribution


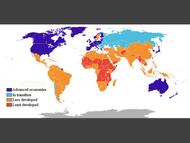
The United Nations Environmental Program (UNEP) predicted in 2005 that 50 million people could become climate refugees by 2010. UNEP produced a map identifying areas of the globe threatened in various ways by climate change.

The President of the UN General Assembly said in 2008 that it had been estimated that between 50 and 200 million people could become climate refugees. The Environmental Justice Foundation warned that “10% of the global population is at risk of forced displacement due to climate change.” Some scientists have been claiming for years that there are already 25 million climate refugees. These predictions, statements and claims have failed to materialize and have been abandoned. The Asian Correspondent published an article asking what happened to these climate refugees, which concluded as follows:

“However, a very cursory look at the first available evidence seems to show that the places identified by the UNEP as most at risk of having climate refugees are not only not losing people, they are actually among the fastest growing regions in the world.”

More recently, there has been a concerted effort to link migration from the Middle East and Africa to climate change, primarily by correlating climate “stress” with the climates of war, poverty, religious persecution and gang violence in the countries from which they are fleeing. In some cases, weather events such as droughts and floods have been conflated with climate change, as if to suggest that such events had not occurred previously in these countries, though this is hardly the case.

Most recently, former US Vice President Al Gore and others have asserted that the refugee caravans fleeing Central America are the result of climate change. These assertions are essentially denied by the refugees themselves, who acknowledge that they are fleeing high unemployment, poverty, gang violence and, in some cases, adverse weather events. They are seeking a better life in the US, not merely refugee status in Mexico.

However, these Central American refugee caravans appear not to be spontaneous responses to conditions in their countries. Rather, these caravans are organized, funded, directed and supported by individuals or organizations which have chosen to keep their identities secret; and, aided by the UN Migration Agency. The organization of these caravans is obvious, based on the food, water, sanitation and transportation resources which have been provided along their routes of travel. The direction being provided has caused the caravans to travel greater distances to approach the US border at California, rather than Arizona, New Mexico or Texas.

The first and so far, only self-declared climate refugee, a resident of the island nation of Tuvalu, was denied refugee status in New Zealand since Tuvalu, rather than succumbing to the ravages of rising sea levels, is actually increasing in area. The Maldives, which at one point were the “poster child” for imminent climate refugee migration to higher land, are also growing in land area.

The issue of climate refugees, should there ever be any such refugees, would give rise to demands for financial support and ultimately compensation, raising again the issue of the standards of evidence applied to support and compensation decisions.


Tags: Climate Refugees, United Nations

Climate Models?

Our understanding of global warming and cooling is based on both paleoclimatic analysis and instrumental data. Our understanding of climate change is based on observations of temperatures, sea level changes, hurricane and tornado frequency and intensity, flood and drought frequency and intensity, and other factors. Our understanding of anthropogenic climate change is based on the estimated impacts of emissions and land use changes.

Our understanding of potential catastrophic anthropogenic climate change is based on unverified models, tuned against “adjusted” temperature history, fed with estimated climate sensitivities and feedbacks and uncertain climate forcings. These models are typically referred to as climate models, which suggests that they actually model the real climate. However, the model developers acknowledge that there are numerous factors which affect the climate which are not included in the models because they are not sufficiently well understood. There are also likely to be multiple factors which also affect climate but are not known to do so.

Therefore, it is not reasonable to expect that projections made years ago based on these models would match the observed changes in climate over the recent past; and, it is totally unreasonable to expect that these models have any predictive value regarding future climate. The only way that the current models could match the changes in the real climate is if the factors currently included in the models are modeled accurately, the sensitivities, feedbacks and forcings selected are correct, and the factors which are not currently modeled perfectly cancel each other over the modeled period. In a complex, chaotic environment, these conditions are exceeding unlikely to be met.

Dr. Patrick Frank of the Stanford Synchrotron Radiation Lightsource/SLAC at Stanford University, has recently suggested that errors in climate models are large and that they propagate over the period modeled.

“GCM global air temperature projections are no more than linear extrapolations of green house gas forcing. Linear propagation of error is therefore directly warranted. GCMs make large thermal errors. Propagation of these errors through a global air temperature projection will inevitably produce large uncertainty bars.”

Dr. Frank calculated that current models, using Representative Consumption Pathway 8.5 estimates of future global CO2 emissions, would experience an uncertainty envelope of +/-17°C.

“The large uncertainty bars do not indicate possible increases or decreases in air temperature. They indicate a state of knowledge. The uncertainty bars are an ignorance width.”

This uncertainty envelope is enormous relative to the projected future temperature anomalies. Dr. Frank compared this uncertainty envelope with the Hansen 1988 temperature anomaly projections here at 28:17. Clearly uncertainty of this magnitude suggests that modeled scenarios of potential future climate conditions are of no significant scientific value, though their political value should not be underestimated.

Uncertainties in projections of future climate of this magnitude make a mockery of assertions that “the science is settled”. These uncertainties also highlight the scientific uselessness and political motivation of the numerous “scary scenario” studies funded with federal resources which might otherwise be used to advance the state of climate science.


Tags: Climate Models, Climate Predictions

Highlighted Article: Good News! No Need to Have a Mental Breakdown Over 'Climate Collapse'


From: reason.com

By: Ronald Bailey


Good News! No Need to Have a Mental Breakdown Over 'Climate Collapse'


"What if I told you there was a paper on climate change that was so uniquely catastrophic, so perspective-altering, and so absolutely depressing that it's sent people to support groups and encouraged them to quit their jobs and move to the countryside?" asks reporter Zing Tsjeng over at Vice. She is citing Cumbria University Professor of Sustainability Leadership Jem Bendell's "Deep Adaptation" paper, which asserts that man-made climate change will result in "a near-term collapse in society with serious ramifications for the lives of readers." How near-term? In about 10 years or so..."


Good News! No Need to Have a Mental Breakdown Over 'Climate Collapse'


Tags: Highlighted Article

Attribution Absurdity

In the current mantra of the consensed climate science community, every adverse weather-related event is alleged to have been caused by, or worsened by, climate change. Unverified climate models are being used in attribution studies to calculate the supposed percentage by which certain events were worsened by climate change. The attributed percentages vary wildly, depending on which model is used and which assumptions are input to the model.

Perhaps the most absurd collection of attributions relates to the recent wildfires in California. State government officials have been quick to attribute the occurrence or increased extent and intensity of most of these wildfires to climate change. Post-fire investigations have established that the fires were the result of numerous causes including arson, out-of-control homeless camp cooking and heating fires, and improperly maintained and operated electric transmission facilities.

The most destructive of the recent wildfires, the Camp Fire, is believed to have been caused by electric transmission facilities owned and operated by Pacific Gas and Electric Corporation, California’s largest utility.

“Cal Fire has determined that PG&E likely broke state law in connection with 12 of the 2017 fires, and is investigating the utility’s possible role in the Camp Fire. The Nov. 8 wildfire killed 86 people in the Paradise area, more than any other fire in California history. In disclosures to the state Public Utilities Commission, PG&E has acknowledged significant problems occurred on a transmission tower near the site where the Camp Fire is believed to have started.”

PG&E has since filed for Chapter 11 bankruptcy protection because of its potential legal liability resulting from the numerous wildfires believed to have been caused by its facilities. The Wall Street Journal described the PG&E bankruptcy as: “The First Climate-Change Bankruptcy”, though it has since provided a more comprehensive attribution. However, based on the Cal Fire determination shown above, numerous studies of forest management practices and analysis of the growing urban-forest interface, it appears absurd to attribute the PG&E bankruptcy or the California wildfires to climate change.

Wildfires occur for a number of reasons. It is not possible to prevent wildfires, but it is possible to minimize their occurrence and reduce the damages they cause. Improved forest management practices have the potential to greatly reduce wildfire damage, but are frequently resisted by environmentalists on the grounds that active forest management disturbs the natural order. Unfortunately, in many cases, wildfires are the natural order.

Attribution of wildfires and other naturally-occurring events to climate change is politically convenient, in that it diverts attention from other causes, focusing it instead on catastrophic anthropogenic global warming and climate disruption. Climate change does not start wildfires. Climate change does not add fuel sources to the forest floor which contribute to the intensity and spread of wildfires. The alleged contribution of climate change is changes in precipitation which encourage the growth of various types of plants when precipitation increases, providing an increased stock of combustible material when precipitation decreases. However, precipitation has varied seasonally and annually for as long as man has been monitoring precipitation; and, wildfires were occurring long before anthropogenic climate change became an issue.

Focusing attention away from the actual causes of wildfires will do nothing to reduce their occurrence or effects.


Tags: Climate Alarmists

Highlighted Article: The "New Energy Economy": An Exercise in Magical Thinking


From: Manhattan Institute

By: Mark P. Mills


THE “NEW ENERGY ECONOMY”:AN EXERCISE IN MAGICAL THINKING


"A movement has been growing for decades to replace hydrocarbons, which collectively supply 84% of the world’s energy. It began with the fear that we were running out of oil. That fear has since migrated to the belief that, because of climate change and other environmental concerns, society can no longer tolerate burning oil, natural gas, and coal—all of which have turned out to be abundant.


“So far, wind, solar, and batteries—the favored alternatives to hydrocarbons—provide about 2% of the world’s energy and 3% of America’s. Nonetheless, a bold new claim has gained popularity: that we’re on the cusp of a tech-driven energy revolution that not only can, but inevitably will, rapidly replace all hydrocarbons..."


THE “NEW ENERGY ECONOMY”:AN EXERCISE IN MAGICAL THINKING


Tags: Highlighted Article

Near-Surface Temperature


Much has been written about the physical shortcomings of the near-surface temperature record, which include:


  • inadequate spatial coverage;
  • urban heat island effects;
  • sensor degradation;
  • enclosure degradation;
  • wind and solar dependent biases;
  • inconsistent time of observation;
  • missing data; and,
  • numerous lesser issues.


These issues have been compounded by sensor and enclosure changes over time and measuring station relocation. These factors have led to “adjustment” of the measured temperature data intended to account for these issues.

Far less attention has been paid to the statistical shortcomings of the near-surface temperature record. Two of the most important statistical shortcomings are improper treatment of measurement noise and inadequate frequency of measurement.

Dr. Patrick Frank has calculated the lower limit of instrument noise in the global temperature record for well sited and maintained installations as +/-0.46°C. He has further estimated that the lower limit of the instrument noise for the global near-surface temperature installations is likely twice the lower limit of +/-0.46°C for well sited and maintained sites. These values far exceed the confidence limits (+/-0.10°C) typically reported by the producers of the global temperature anomaly products. If Dr. Frank’s estimate of the instrument noise in the global records is correct, the instrument noise is greater than the reported global temperature anomaly over the entire period of the global instrument temperature record, rendering the reported anomalies insignificant, as discussed in more detail here.

William Ward asserts that “air temperature is a signal and measurement of signals must comply with the mathematical laws of signal processing. The Nyquist-Shannon Sampling Theorem tells us that we must sample a signal at a rate that is at least 2x the highest frequency component of the signal. This is called the Nyquist Rate. Sampling at a rate less than this introduces aliasing error into our measurement.” Ward demonstrates that the aliasing error resulting from recording only daily maximum and minimum temperatures and calculating the mean of those two temperature readings results in a mean aliasing error of 1.4°C, approximately 50% greater than the reported global temperature anomaly over the period of the global instrumental temperature record. Ward also demonstrates that daily errors range up to +/-4°C.

Ward also demonstrates that temperature sampling at rates less than the Nyquist Rate can induce errors in the calculated temperature trends. Trend errors calculated for 26 selected sites range from +0.24°C to -0.17°C per decade, with an average of 0.06°C per decade. This compares with a reported warming trend over the period 1880-2012 of 0.064 +/- 0.015°C (Wikipedia) and a reported warming trend of 0.13°C per decade over the period of the satellite temperature record. Essentially, the reported warming trend shown above is actually (0.064 +/- 0.015°C) +0.24°C / -0.17°C; that is, it is essentially meaningless.

The USCRN is currently considered to be the “gold standard” for near-surface temperature measurement because its sites are CRN-1 sites, located remotely from existing development, use three separate precision temperature sensors and are sampled at the practical Nyquist Rate of 4,320 samples per day, or one sample every 20 seconds. The CRN is the reference for both the Frank and Ward studies. Unfortunately, the CRN is not a global system and it lacks a 30 year historical climate reference period.


Tags: Temperature Record

Highlighted Article: Heartland Institute Special Edition To The Green New Deal


From: The Heartland Institute

By: H. Sterling Burnett


Special Edition Devoted To The Green New Deal


"The much-hyped Green New Deal (GND) is being pushed by a rump group of progressive-socialists in the Democratic Party, including prominent members of the Senate with stated presidential aspirations. If enacted, GND would constitute a complete socialist makeover/takeover of the economic system of the United States."


Special Edition Devoted To The Green New Deal


Tags: Highlighted Article

Adaptation and Survival

The universe is estimated to be approximately 13.7 billion years old. Our solar system is estimated to be approximately 4.6 to 5 billion years old, while the earth is estimated to be approximately 4.3 to 4.6 billion years old. Earth’s history is one of periodic glacial periods, shifting continents, volcanic creation and destruction, occasional meteor impacts and a variety of other major and minor events.

Our understanding of earth’s atmosphere and climate is very limited prior to approximately 500 million years ago. The graph below illustrates our current understanding of the earth’s climate history over that period.

Temperature on Planet Earth

The most recent period in earth’s history is arguably the period of greatest temperature stability in the historical record. However, it is obvious the climate continued to change over this period. There is no obvious period of temperature stasis anywhere in the record; and, it seems strange to suggest that the current period should become a period of temperature stasis. There is also no reason to believe that Milankovitch cycles have ceased. Rather, the graph above suggests that the earth might be approaching the peak of a Milankovitch cycle, which would then be followed by several thousand years of cooling temperatures.

The graph below illustrates both the temperature and atmospheric CO2 concentration over the entire estimated period of earth’s existence. Temperatures and CO2 concentrations in the atmosphere have been substantially higher in the past than is the case today. The glacial periods shown in the graph above all occurred when atmospheric CO2 concentrations were as high as or higher than current atmospheric CO2 concentration, as shown in the graph below.

Geological Timescale of CO2

Dr. Vincent Gray’s conclusion from this graph: “It will be seen that there is no correlation whatsoever between carbon dioxide concentration and the temperature at the earth’s surface.”

Modern humans as we know them are thought to have evolved approximately 315,000 years ago, though there is evidence of other hominin species as long as 6-8 million years ago. The red X in the graphs above indicate the approximate appearance of modern humans. Modern humans are believed to be the only one of the hominin species which has survived. However, if we accept Darwin’s Theory of Evolution, the predecessor organisms of modern humans and all other currently existing creatures have existed on earth throughout its existence, adapting and surviving or not adapting and becoming extinct.

The graphs above make it clear that our human ancestors have adapted, survived and ultimately thrived through a series of temperature changes. The historical record illustrates that humans have fared better in warm than in cool periods. The temperature changes during the Roman Warm Period, the Medieval Warm Period, the Little Ice Age and the current warm period pale in comparison to the temperature changes labeled as the Milankovitch Cycles in the first graph above, no less the temperature changes which occurred more than 8 million years ago.


Tags: Global Temperature, Temperature Record

Highlighted Article: Hurricanes and Climate Change


By: Judith Curry

A five part series from Climate Etc.

"This Report is easier than my Special Report on Sea Level and Climate Change.  Sea level and glaciers are very fast moving topics, whereas for hurricanes, the big picture conclusions haven’t really changed in a decade."


1) Hurricanes & climate change: detection

2) Hurricanes and Climate Change: Attribution

3) Hurricanes & climate change: landfalls

4) Hurricanes & climate change: recent U.S. landfalling hurricanes

5) Hurricanes & climate change: 21st century projections


Tags: Highlighted Article

Highlighted Article: What Rising CO2 Means for Global Food Security

From: CO2 Coalition

February 21, 2019


What Rising CO2 Means for Global Food Security


Plant production has been boosted, the need for water and fertilizer has been brought down, and field experiments show that these effects are likely to increase in coming decades.

Global food security is one of the most pressing problems facing the planet’s growing population. Continuing advances in agricultural technology and expertise will certainly increase food production in many regions, but the required doubling of production by 2100 as diets improve with rising income will still be a difficult task. Fortunately, carbon dioxide (CO2), a non-polluting gas that is created when fossil fuels are converted into energy, has proved to be a powerful plant food.


What Rising CO2 Means for Global Food Security


Tags: Highlighted Article
Search Older Blog Posts