Call or complete the form to contact us for details and to book directly with us
435-425-3414
435-691-4384
888-854-5871 (Toll-free USA)


Contact Owner

*Name
*Email
Phone
Comment
 
Skip to Primary Navigation Skip to Primary Content Skip to Footer Navigation

In the Wake of the News

Shifty(?) Climate Sands

The Biden/Harris position on climate change has been shifting (shifty?) as their political campaign has “progressed” toward election day. The Green New Deal is one of the key issues on which the campaign has shifted with regard to climate. The Biden campaign website states: “Biden believes the Green New Deal is a crucial framework for meeting the climate challenges we face.” Senator Harris is a co-sponsor of the Green New Deal in the Senate and has previously supported it on the campaign trail. However, Biden has now stated that he does not support the Green New Deal. Climate change is only one aspect of the Green New Deal, which deals with air travel, high speed rail, building energy efficiency and electric vehicles. Virtually all other aspects of the Green New Deal are reflected in both the 2020 Democrat Party Platform and the Biden Platform.

One of the key factors in the reduction of US CO2 emissions has been the shift from coal to natural gas for electric power generation. This shift was largely made possible by hydraulic fracturing, which has made natural gas far more available. The Biden/Harris position on fracking has changed from “ban fracking” to “ban fracking on public lands” to “not ban fracking”. Biden has also stated that there would be no more fossil fueled power plants built under his administration. Biden/Harris are committed to eliminating CO2 emissions from power generation by 2035, five years later than the Green New Deal schedule.

Biden has committed to incentivizing installation of 500,000,000 solar modules and 16,000 wind turbines. While these are large numbers, they are relatively trivial in comparison with the numbers needed to replace all existing fossil fueled power generation facilities with intermittent renewable generators and storage systems. Solar and wind currently supply approximately 12% of US electricity. However, this capacity is currently backed up by fossil fueled generation; and, in general, is dispatched first under environmental dispatch orders. Combined solar and wind generation capacity would therefore have to be increased by roughly an order of magnitude to supply approximately all of US electricity consumption, even with continuing fossil fuel backup. Eliminating the fossil fuel backup would require installation of significant additional generating capacity plus long term, high draw storage capacity sufficient to supply power for several days. This storage technology is not currently commercially available.

While a Biden/Harris administration would incentivize solar and wind installations, the majority of the investment required to install these systems would be required to be provided by private sources, such as investor owned electric utilities, other businesses  and homeowners. In the process, the utilities would be forced to abandon existing, functioning fossil fueled generating capacity, at a loss of approximately $4 trillion.

The switch from fossil fueled generation to renewable generation would also strand huge quantities of coal, oil and natural gas, causing a dead weight loss of $50+ trillion, which would be borne by both private owners and the government. These costs are not considered when the Biden asserts that: “The Green New Deal will pay for itself as we move forward.”


Tags: 2020 Election, Green New Deal

Highlighted Article: Alterations To The US Temperature Record


From: Real Climate Science

By: Tony Heller

Date: October 1, 2020


Alterations To The US Temperature Record


"For the past decade or so, I have been documenting how US temperature graphs released by NOAA and NASA are not representative of their own raw data. This work has been high profile on a number of occasions, but has been repeatedly censored by the press as “conspiracy theory.” This happened as recently as yesterday on DailyKos.

Reality is that the data alterations are no secret, and that NOAA and NASA acknowledge that they do it. In this post I will document the magnitude of the adjustments and how they can be visualized.

This graph of US temperatures was posted by NASA in 1999, showing a strong cooling trend from the 1930’s through the end of the century. The years 1934 and 1998 are circled." ...


Alterations To The US Temperature Record


Tags: Highlighted Article

Biden Climate Plan

The Biden Climate Plan is very similar in scope and intent to the Democrat Climate Platform with one notable exception. The Democrat climate platform does not mention the Green New Deal, though the Biden Plan identifies it as a “crucial framework for meeting the climate challenges we face”. Biden has selected Alexandria Ocasio-Cortez and John F. Kerry to lead his Climate Task Force, both of whom are strong advocates for the Green New Deal.

The Biden Climate Plan is more specific in certain aspects than the Democrat Climate Platform. These specifics are being enunciated and modified on the campaign trail, so it is not certain how the final plan will play out. For example, Biden has enunciated several inconsistent positions on the future of hydraulic fracturing for oil and gas development, ranging from a total ban on fracking to a ban on fracking on “public lands”, including offshore areas.

The Biden campaign has adopted the slogan: “Build Back Better”. However, this slogan does not really apply to the US energy sector, since nothing in the US energy sector has been destroyed or severely damaged, so there is no need to build back since the existing infrastructure is functional and is meeting the nation’s energy needs. Arguably, the only real opportunity to “Build Back Better” exists in the Democrat-controlled cities which have been ravaged by rioting, looting and arson. However, based on the local and state government responses to the rioting and destruction, it is doubtful whether most of the businesses destroyed will choose to build back at all.

The Biden plan commits to rejoining to the Paris Accords and to further funding of the UN Green Climate Fund. It proposes to achieve greater “ambition” in the US participation and to actively seek greater ambition from the other signatories to the Paris Accords. The Biden plan sets no requirements for greater ambition globally relative to the increased ambition of the US participation. It ignores the total lack of “ambition” under the accords by China and India, among others.

The Biden plan, as explained on the campaign trail, proposes some $1 trillion plus federal funding intended to incentivize private funding and investment in net-zero facilities and equipment. However, the federal funding level and the envisioned private funding fall far short of the estimated costs of the Green New Deal. There is also no recognition of the $60+ trillion deadweight loss associated with abandoning fossil fuel resources in the ground and replacing functioning electric generation infrastructure before the end of its useful life.

The differences between the Biden plan commitment to federal funding and the actual funding requirement necessary to accomplish the goals established in the plan would be achieved by a combination of legislation and regulation compelling private sector expenditure and investment.

The Biden Climate Plan and the Democrat Climate Platform both represent government on steroids, insinuating government at all levels into corporate and personal decision making. While Biden asserts he will not raise taxes on those earning less than $400,000 per year, his plan will certainly impose other, non-tax costs and investments on virtually all taxpayers.


Tags: Green New Deal, Climate Policy, 2020 Election

Highlighted Article: A History of Global Temperature For Those Who Never Studied Geology


From: CFACT

By: Terigi Ciccone, Dr. Jah Lehr

Date: October 6, 2020


A History of Global Temperature For Those Who Never Studied Geology


"We have long thought that if more people had been required to take a course in Geology in High School, the human-caused global warming exaggerations would be more difficult to pull off on an unsuspecting public. Our simplified version of what is going on in and around the Earth should help fill the void.

 The way the Earth formed, its rotational path around our sun, and its own axis are typically taught in Geology but ignored by the well-financed climate modelers. They are arrogant enough to throw a few variables into an equation claiming its solution predicts our Earth’s temperature decades hence. Sadly you and they disregard the known fact that your TV weatherman is correct on his 7-day forecast only 56% of the time. The modelers will tell you that climate and weather are two different things ..."


A History of Global Temperature For Those Who Never Studied Geology


Tags: Highlighted Article

Democrat Climate Platform

The 2020 Democrat Party Platform covers a broad range of topics. The section of the platform dealing with climate is entitled “Combating the Climate Crisis and Pursuing Environmental Justice”.

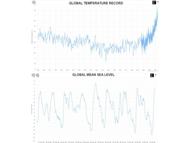
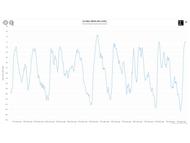
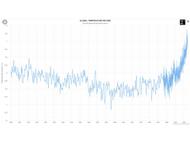
The section begins with the statement: “Climate change is a global emergency.”, though no source is provided for the emergency declaration. The statement is then “supported” by factual assertions regarding recent weather events and resulting economic losses, though there is no evidence that these weather events were the result of, or were aggravated by, climate change. These factual assertions are then followed by an assertion that: “Thousands of Americans have died.”, suggesting a link to climate change though there is no record of Americans dying from climate change. Finally, the section asserts, counterfactually, that: “Pacific Islanders…are losing their traditional way of life as sea level rise submerges their homelands.”.

The first climate platform plank deals with rejoining the Paris Climate Agreement, seeking increased “ambition” under the Paris Accords from other nations.

The second platform plank commits to investment in clean energy generation and energy efficiency.

The third platform plank to mobilizing youths into a corps and cohort challenged to conserve public lands and deliver clean energy.

The fourth platform plank commits to eliminating carbon pollution from power plants by 2035. It further commits to install 500 million solar panels and 16,000 wind turbines; and, to a “technology neutral approach” to new power generation, including nuclear and carbon capture and storage.

The fifth platform plank commits to making “energy saving upgrades to up to 2 million low-income households and affordable and public housing units within 5 years”.

The sixth platform plank commits to “a national goal of achieving net-zero greenhouse gas emissions for all new buildings by 2030 and to incentivizing tens of billions of dollars of private-sector investment to retrofit 4 million buildings”. 

The seventh platform plank commits to “transitioning the entire fleet of 50,000 school buses to American-made zero emission alternatives within 5 years” and transitioning 3 million government vehicles to zero-emissions vehicles. It also commits to “partnering with state and local governments to install at least 500,000 public charging stations from coast to coast.”

The eighth platform plank commits to “apply a carbon adjustment fee at the border” to products from countries not in compliance with the Paris Accords.

The ninth platform plank commits to empowering local communities to become more resilient to the projected impacts of the “climate crisis”.

The tenth platform plank commits to increasing support for wetlands restoration as protection against sea level rise and storm surge.

The eleventh platform plank commits to “require public companies to disclose climate risks and greenhouse gas emissions in their operations and supply chains” and to hold polluters and corporate executives accountable for intentionally hiding or distorting material information and for affecting the health and safety of workers and communities.”

A recurrent theme within the climate platform is the creation of “millions of family-supporting and union jobs”.

The concept of the “carbon adjustment fee”, as stated in the platform, ignores the fact that neither China nor India has made any commitments under the Paris Accords and thus arguably cannot be “not in compliance” with the Paris Accords.

The platform  plank regarding public companies seems certain to trigger a flood of lawsuits intended to “milk” the companies to fund the other platform planks.


Tags: 2020 Election, Climate Policy

Highlighted Article: Your Life Under the Green New Deal


From: CFACT

By: Paul Driessen

Date: October 5, 2020


Your Life Under the Green New Deal


"During the cantankerous September 29 presidential “debate,” candidate Joe Biden proclaimed “I am the Democratic Party.” He is in charge, he insisted, and his views will be Democrat policy. Others aren’t so sure – about that, about what his views actually are, or about how far to the left he would be pushed, prodded and pressured by Kamala Harris, AOC, Bernie Sanders, Nancy Pelosi, Chuck Schumer, Antifa mobs, and coastal and blue city governing, academic and technology elites." ...


Your Life Under the Green New Deal


Tags: Highlighted Article

A Failure of Proof

In the previous commentary, A Failure of Belief, I asserted that neither science nor authority should require belief, but that both should require proof. I also asserted that both science and authority had demonstrated that they did not deserve to be believed regarding the two “crises” at issue, COVID19 and climate change. Since a basis for belief does not exist in either case, acceptance can only be based on proof; that is, on data which obviate the need for belief. Regrettably, the available data does not reach the level of proof regarding either of the “crises”.

In the case of COVID19, the primary data would consist of number of cases of the disease and number of deaths resulting from the disease. However, a high (though unknown) percentage of those who contract the disease remain asymptomatic and thus are likely not to be included in the number of cases unless they have tested positive. These individuals are not likely to have been tested because they have perceived no reason to be tested. Therefore, the data regarding the number of cases in the population are questionable and unreliable. This data reliability issue is compounded by numerous instances of false or misleading reporting of test results, such as the case in Florida in which positive test results were reported as 90+% when the actual results were 9+%.

COVID19 death data are also unreliable because of the varying criteria used by jurisdictions to classify a death as being from COVID19. For example, some jurisdictions report any death of an individual who tested positive for COVID19 as a COVID19 death, even in cases in which the actual cause of death was a traffic accident or a shooting or some pre-existing health condition. This situation renders the death data almost useless, though it has been used by the media regardless.

In the case of climate change, the primary data would consist of temperature measurements and sea level measurements. The temperature data are “adjusted”, reducing their provenance to estimates; and, there are differences in the “adjusted” temperature measurements among the sources of the original data. The sea level data are measured by two fundamentally different methods and the resulting measurements differ by a factor of two. Therefore, neither set of measurements rises to the level of proof of a particular situation.

Consensed climate science focuses on anthropogenic CO2 and other “greenhouse gases” as the cause of climate change, but there is no data which proves that anthropogenic “greenhouse” gases are the cause, or even a cause, of climate change; or, data which proves that the natural variation which caused climate change in the past has ceased to function.

Some in authority claim that climate change has caused increased hurricane frequency and severity, increased tornado frequency and intensity, more frequent and more intense precipitation and droughts, etc. However, these claims are counterfactual based on observational data. There exists no proof that climate change has had any measurable impact on severe weather frequency or intensity.

The combination of a Failure of Belief and a Failure of Proof result in confusion and uncertainty, both of which appear justified.


Tags: Adjusted Data, Covid 19

Analytical Caution

The previous commentaries on coincidence and causation regarding temperature anomalies and sea level referred to two interactive composite graphs (here and here). These graphs each combine paleoclimatic estimates of historical conditions with “adjusted” data from the instrumental records. The graphs present both the paleoclimatic reconstructions and the “adjusted” instrumental data to two decimal place precision. This level of precision is unrealistic for the “adjusted” instrumental data and completely unreasonable for the paleoclimatic reconstructions.

The currently reported global average near-surface temperature anomalies are calculated from datasets which have been “adjusted” to reduce perceived inaccuracies in the original data; and, in some cases, have had temperature estimates “infilled” where real instrumental data do not exist. Most of the instrumental data is measured to one decimal place and the adjustments are made in that one decimal place. Therefore, the number in the first decimal place in the original data is an estimate in the “adjusted” temperature record and any number in the second decimal place is the result of an averaging calculation. The Law of Large Numbers legitimizes such calculations in the errors in the numbers are random, an unreasonable assumption regarding “adjusted” temperatures.

The datasets are not truly global since there are no instrumented sites in many locations. This is particularly true regarding sea surface temperatures, where the instrumentation is far less extensive than on land. The sea surface temperature measurements still include measurements taken by ships, using a variety of measurement protocols, though these are largely being replaced by data from purpose-designed buoys.

The currently reported sea level anomalies are calculated both from a limited number of coastal tide gauges and from satellites. The tide gauge data are confounded by changes in elevation of the measuring instruments due to isostatic rebound and land subsidence. The satellites currently measure changes in sea level approximately twice the values measured by the tide gauges. With this large, unresolved difference in instrumented measurements, it is not realistic to report sea level during the instrumental period to two decimal place precision, since the difference exists to the left of the decimal point.

Composite graphs such as those linked above join the paleoclimatic portion of the curve to the instrumental portion of the curve at a point, indicating a smooth transition from one to the other. Such graphs do not continue to show the values which the paleoclimatic analysis would have produced had it been continued beyond the beginning of the instrumental record, so it is not possible to compare the results of the two methods. One example of the problems this issue can cause is what Professor Phillip Jones of the University of East Anglia described as “Mike’s Nature Trick”, referring to Professor Michael Mann’s decision to transition from the paleoclimatic portion of his “hockey stick” graph to “adjusted” instrumental data at the point at which the paleoclimatic temperatures began to decline while the instrumental temperatures were increasing. The difference in the direction of temperature change between the two diverse sources from that point calls into question the validity of the analysis.


Tags: Global Temperature, Temperature Record, Sea Surface Temperature (SST), Sea Level Change

Highlighted Article: ‘Stopping Climate Change’ is a Laughing Matter

From: America Out Loud

By: Dr. Jay Lehr & Tom Harris

Date: September 15, 2020


‘Stopping Climate Change’ is a Laughing Matter


"We hear it all the time from politicians, the press and activists: ‘we must stop climate change!’

Of all the nonsensical statements emanating from the left, this one has to be the most idiotic. The only sensible response from rational people is laughter. They might as well be chanting, ‘stop continental drift,’ for all the good it will do. As Carleton University Earth Sciences Professor Tim Patterson pointed out, “Climate is and always has been variable. The only constant about climate is change; it changes continually.” From that perspective, President Donald Trump is the exact opposite of a climate change denier—he says that climate changes naturally all the time." ...


‘Stopping Climate Change’ is a Laughing Matter


Tags: Highlighted Article

Coincidence / Causation - Sea Level

  • Coincidence: the occurrence of events that happen at the same time by accident but seem to have some connection, Merriam-Webster
  • Causation: the act or agency which produces an effect, Merriam-Webster
  • Contributory: of, relating to, or forming a contribution: playing a part in bringing about an end or result, Merriam-Webster


Sea Level

The linked graph is a paleoclimatic reconstruction of global sea level over approximately the past 800,000 years. The sea level roughly approximates a sine wave with a maximum amplitude variation of approximately 146 meters. The peak sea level positive anomaly is approximately 12.9 meters approximately 400 million years ago, while the peak negative anomaly is -133 meters approximately 20,000 years ago, both relative to a zero anomaly approximately 4,000 years ago. Clicking on the right-hand icon in the upper left corner of the page overlays the temperature anomaly on the graph.

Clicking on the left-hand icon in the upper left-hand corner of the page shifts the time scale to the most recent 1,020 years and also changes the units of measure on the “Y” axis from meters to centimeters. On this timescale, the peak sea level anomaly is +21.36 centimeters (0.214 meters), approximately 1/60th of the peak anomaly in the historical record. The increased intensity of the graph lines after 1890 is indicative of the start of “global” instrumental measurement. Clicking the right-hand icon in the upper left corner of the page overlays the temperature anomaly on the graph. The year 1000 at the left of the graph is early in the Medieval Warm Period. The period from 1350 to 1850 spans the Little Ice Age. The balance of the graph displays the Modern Warm Period through June 2020.

It is clear on both timescales that sea level follows temperature changes. The temperature and sea level changes prior to approximately 1950 are considered to represent natural variation. The rapid, short-term changes in both temperature and sea level in the instrumental record are also considered to represent natural variation. The positive and negative fluctuations in the anomalies have numerous, differing contributory causes. The causes are not well understood and their relative contributions to the positive and negative anomaly changes cannot be determined, even during the period of the instrumental temperature and sea level records.

The graph of the past 1020 years shows that the global temperature anomaly has been increasing, with significant fluctuations, since before the beginning of the instrumental records, approximately 70 years prior to 1950, when anthropogenic CO2 emissions are believed to have become significant. Therefore, during that 70-year period, it is extremely unlikely that anthropogenic CO2 emissions were the cause, or even a contributory cause, of the increasing temperature anomaly. The global sea level anomaly did not begin to increase until the beginning of the instrumental record and appears to lag the increasing temperature anomaly by approximately 80 years.

Since 1950, the temperature and sea level anomalies and atmospheric CO2 concentrations have been increasing. There is no scientific reason to believe that the forces which caused increasing temperature and sea level anomalies over the period from 1880-1950 ceased to function after 1950. Therefore, it is highly unlikely that the temperature and sea level anomaly increases from 1950-2020 were caused by increasing atmospheric CO2. Physics suggests that increased atmospheric CO2 concentrations should increase global temperatures and global sea levels, so it is also highly unlikely that the post-1950 temperature anomaly increase is a mere coincidence. Rather, increasing atmospheric CO2 concentrations are most likely a contributing factor to the temperature and sea level anomaly increases, though the relative magnitude of the CO2 effect cannot be measured.


Tags: Sea Level Rise, Sea Level Change

Highlighted Article: The Democrats’ Climate Platform Belongs In Neverland


From: America Out Loud

By: Dr. Jay Lehr & Tom Harris

Date: September 9, 2020


The Democrats’ Climate Platform Belongs In Neverland


"The Democratic Party has abandoned rational thought about climate change. Rather than focus on preparing for the real problems of a continually changing climate, they concentrate instead on the politically correct but scientifically impossible goal of ‘stopping climate change.’ They seem to have flown away to Neverland.

Peter Pan author J. M. Barrie tells us that Neverlands are found in the minds of children. There, with the assistance of fairy dust, Peter Pan can fly and teaches children to ignore their common sense and soar as well. Peter claims greatness, is able to feel danger when it is near and can even imagine things into existence. There is almost nothing the hero of Neverland cannot do, provided he stays childlike.

When it comes to climate change and energy, the Democrats are essentially the same. Reality for them is now more determined by what Al Gore and equally imaginative climate activists say than what real science and observational evidence actually show. That we are as yet unable to meaningfully forecast climate decades in advance, let alone control it, doesn’t matter to the Dems. They simply ignored the fact that every climate prediction the U.N. has made has turned out to be wrong. Humankind has a global thermostat, they imagine." ...


The Democrats’ Climate Platform Belongs In Neverland


Tags: Highlighted Article

Coincidence / Causation - Temperature

  • Coincidence: the occurrence of events that happen at the same time by accident but seem to have some connection, Merriam-Webster
  • Causation: the act or agency which produces an effect, Merriam-Webster
  • Contributory: of, relating to, or forming a contribution: playing a part in bringing about an end or result, Merriam-Webster


Temperature

The linked graph is a paleoclimatic reconstruction of global temperature anomalies over approximately the past 800,000 years. The temperature history approximates a sine wave, with a maximum amplitude variation of approximately 8.8°C. Interestingly, the magnitude of the negative anomalies over time are approximately twice the magnitude of the positive anomalies. The peak positive anomaly approximately 123,000 years ago is 2.68°C, approximately 1.75°C warmer than the June 2020 anomaly.

Clicking the icon in the upper left-hand corner of the graph reduces the timescale to the past 1020 years. In this time period, the maximum negative anomaly is 1.16°C and the maximum positive anomaly is 1.36°C. The increase in the density of the graph lines beginning in 1880 indicates the start of the “global” instrumental temperature record. The year 1000 at the left of the graph is early in the Medieval Warm Period. The period from 1350 to 1850 spans the Little Ice Age. The balance of the graph displays the Modern Warm Period through June 2020.

The positive and negative fluctuations in the anomalies have numerous, differing contributory causes. The causes are not well understood and their relative contributions to the positive and negative anomaly changes cannot be determined, even during the period of the instrumental temperature record. The IPCC suggests 95% confidence that anthropogenic CO2 emissions are the majority contributing cause of the positive anomaly changes over the period since 1950, which is generally recognized as the period in which anthropogenic CO2 emissions began to become significant. However, numerous climate alarmists insist anthropogenic CO2 emissions are the sole cause of the anomaly increase. Neither group has data to prove its assertions.

The graph of the past 1020 years shows that the global temperature anomaly has been increasing, with significant fluctuations, since before the beginning of the instrumental temperature record, approximately 70 years prior to 1950, when anthropogenic CO2 emissions are believed to have become significant. Therefore, during that 70-year period, it is extremely unlikely that anthropogenic CO2 emissions were the cause, or even a contributory cause, of the increasing temperature anomaly.

Since 1950, the temperature anomaly and atmospheric CO2 concentrations have been increasing. There is no scientific reason to believe that the forces which caused increasing temperature anomalies over the period from 1880-1950 ceased to function after 1950. Therefore, it is highly unlikely that the temperature anomaly increase from 1950-2020 was caused by increasing atmospheric CO2. Physics suggests that increased atmospheric CO2 concentrations should increase global temperatures, so it is also highly unlikely that the post-1950 temperature anomaly increase is a mere coincidence. Rather, increasing atmospheric CO2 concentrations are most likely a contributing factor to the temperature anomaly increase, though the relative magnitude of the CO2 effect cannot be measured.


Tags: Temperature Record, Global Temperature

Highlighted Article: Greenhouse Gas Emissions - The Global Picture


From: The Global Warming Policy Foundation

By: Martin Livermore

Date: September, 2020


Greenhouse Gas Emissions - The Global Picture

Summary

The current round of international action on climate change mitigation is achieving little. Under pressure from a powerful environmental lobby, politicians pay lip service to the need for drastic decarbonisation of developed-world economies and commit to increasingly unrealistic targets. Meanwhile, global emissions continue to rise. Even with the major economic disruption caused by the Covid-19 pandemic, it is estimated that global emissions of carbon dioxide in 2020 will be only 5.5% lower than the previous year.

Leaving aside any consideration of the actual effectiveness of decarbonisation – if it could be achieved – it behoves the scientific and political establishment to revise their analysis of what can be done and how to achieve it, and focus efforts on developing realistic and affordable solutions. Fossil
fuels will inevitably be replaced by other sources of energy, but only when credible, economic alternatives are available.

Whatever efforts European states make to reduce emissions, the outcome could simply be to cripple their economies, while China, India and the rest of the less-developed world continues to fuel growth with coal and oil. These countries will never follow the lead of the EU or others until the solutions provided are economic.

Despite this, politicians are reluctant to criticise activists such as Extinction Rebellion, despite their naïve demands for rapid and complete decarbonisation in single countries, which ignore the bigger picture.

In these circumstances, it is far better to focus resources on developing energy generation and storage technologies (plus, potentially, carbon capture technologies) that industry and domestic consumers would choose without compulsion or subsidies. The industrialised world would still be taking a lead, but in a much more rational way.


Greenhouse Gas Emissions - The Global Picture


Tags: Highlighted Article

Solving the Climate Crisis

The US House of Representatives Select Committee on the Climate Crisis has released Solving the Climate Crisis, The Congressional Action Plan for a Clean Energy Economy and a Healthy, Resilient, and Just America, a majority staff report prepared by the majority committee staff. The Committee is composed exclusively of Democrat US representatives. The Committee refers to the document as a “Congressional Action Plan”, though it has not been adopted by the full House of Representatives, nor is there any corresponding plan which has been developed by a select committee in the US Senate and adopted by the full US Senate.

The Executive Summary of the action plan states that: “With the devastating health and economic consequences of climate change growing at home and abroad, the United States must act urgently, guided by science, and in concert with the international community to provide a livable climate for today’s youth and future generations.” Beyond this reference to the international community, the action plan is exclusively focused on actions limited to the US and discusses no requirements for parallel actions on the part of the rest of the nations of the globe.

The action plan bears a striking resemblance to “A Green Stimulus to Rebuild Our Economy”. , which builds upon both the Green New Deal developed by the Green Party in the US and the Blue New Deal developed by the New Economics Foundation in the UK. These proposals are discussed here and here. None of these documents acknowledge that the United States is not capable of “solving the climate crisis” in the absence of equally Draconian actions on the part of all the other nations of the globe, even assuming that such global concerted actions would be capable of “solving the climate crisis”.

The need for development of the action plan is based on the assertion, without any evidence, that: “the devastating health and economic consequences of climate change (are) growing at home and abroad”. These consequences are not identified, except by reference to the following summary comments from the US Fourth National Climate Assessment.

“High temperature extremes and heavy precipitation events are increasing. Glaciers and snow cover are shrinking, and sea ice is retreating. Seas are warming, rising, and becoming more acidic, and marine species are moving to new locations toward cooler waters. Flooding is becoming more frequent along the U.S. coastline. Growing seasons are lengthening, and wildfires are increasing. These and many other changes are clear signs of a warming world.”

The deception summarized in the paragraph above has been documented by Tony Heller in a series of YouTube videos, of which this is the most damning. The contributors to the Assessment “cherry-picked” the start dates in their graphical presentations to present the data beginning with the lowest point in the data for each issue they addressed, rather than showing all of the data from the beginning of the data record.

Climate change is not causing extreme weather, as suggested in the Fourth National climate Assessment, as discussed here. Arguably, the effects of the mild global warming to date and the increased atmospheric CO2 concentrations have been a net benefit to society globally and will continue to be so for the foreseeable future.

The “climate crisis” is a construct of unverified and unrepresentative climate models, which are a wholly inadequate basis for global or national policy development.


Tags: Democrats, Climate Change Debate, Policy
Search Older Blog Posts