Call or complete the form to contact us for details and to book directly with us
435-425-3414
435-691-4384
888-854-5871 (Toll-free USA)


Contact Owner

*Name
*Email
Phone
Comment
 
Skip to Primary Navigation Skip to Primary Content Skip to Footer Navigation
▽ Explore More ▽ Hide

Climate and Climate Change

Climate and Climate Change

Climate Change

Two days before Halloween, 2011, New England was struck by a freak winter storm. Heavy snow descended onto trees covered with leaves.  Overloaded branches fell on power lines.  Blue flashes of light in the sky indicated exploding transformers.  Electricity was out for days in some areas and for weeks in others. Damage to property and disruption of lives was widespread.

That disastrous restriction on human energy supplies was produced by Nature.  However, current and future energy curtailments are being forced on the populace by Federal policies in the name of dangerous “climate change/global warming”.  Yet, despite the contradictions between what people are being told and what people have seen and can see about the weather and about the climate, they continue to be effectively steered away from the knowledge of such contradictions to focus on the claimed disaster effects of  “climate change/global warming” (AGW, “Anthropogenic Global Warming”). 

People are seldom told HOW MUCH is the increase of temperatures or that there has been no increase in globally averaged temperature for over 18 years.  They are seldom told how miniscule is that increase compared to swings in daily temperatures. They are seldom told about the dangerous effects of government policies on their supply of “base load” energy — the uninterrupted energy that citizens depend on 24/7 — or about the consequences of forced curtailment of industry-wide energy production with its hindrance of production of their and their family’s food, shelter, and clothing. People are, in essence, kept mostly ignorant about the OTHER SIDE of the AGW debate.

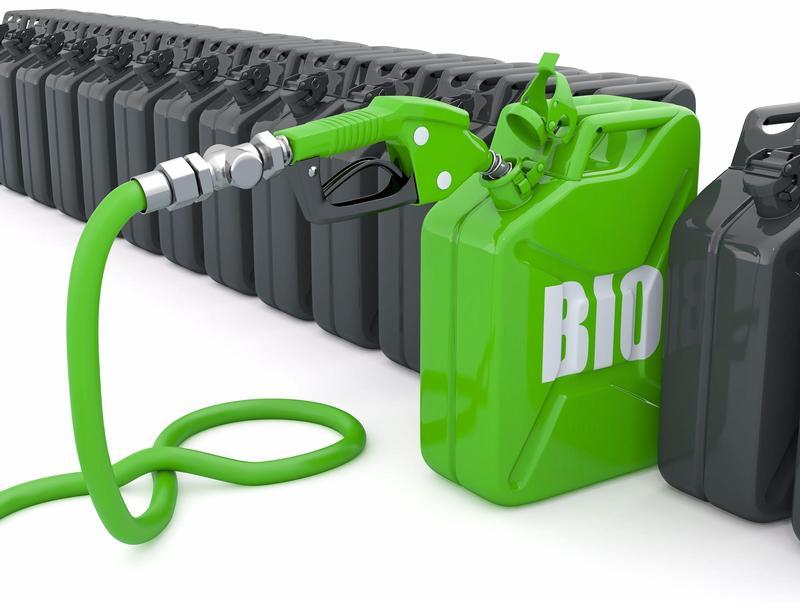
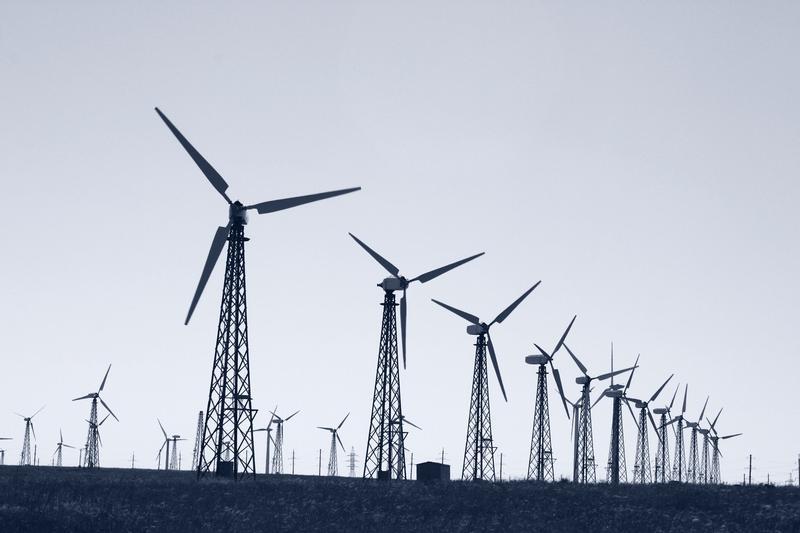
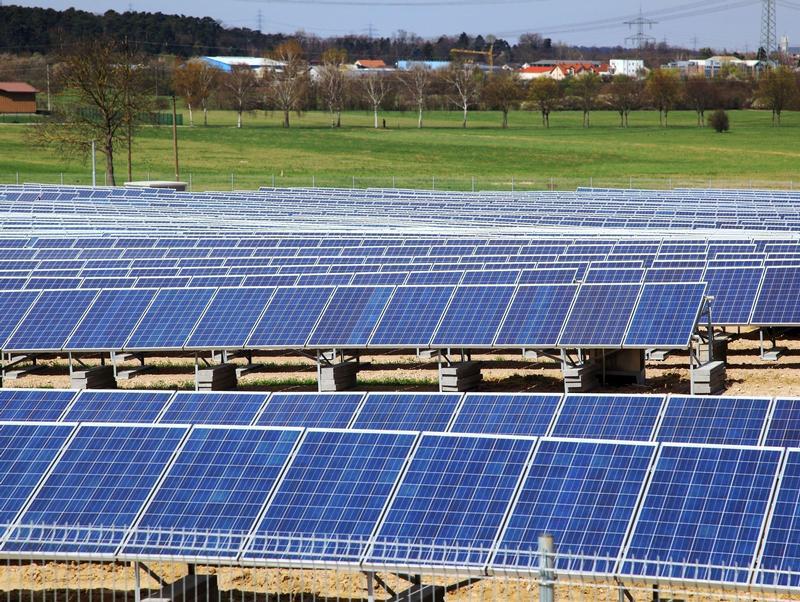
Major scientific organizations — once devoted to the consistent pursuit of understanding the natural world — have compromised their integrity and diverted membership dues in support of some administrators’ AGW agenda.   Schools throughout the United States continue to engage in relentless AGW indoctrination of  students, from kindergarten through university.  Governments worldwide have been appropriating vast sums for “scientific” research, attempting to convince the populace that the use of fossil fuels must be severely curtailed to “save the planet.”  Prominent businesses — in league with various politicians who pour ever more citizen earnings into schemes such as ethanol in gasoline, solar panels, and wind turbines — continue to tilt against imaginary threats of AGW.  And even religious leaders and organizations have joined in to proclaim such threats.   As a consequence, AGW propaganda is proving to be an extraordinary vehicle for the exponential expansion of government power over the lives of its citizens. 

Reasoning is hindered by minds frequently in a state of alarm.  The object of this website is an attempt to promote a reasoned approach; to let people know of issues pertaining to the other side of the AGW issue and the ways in which it conflicts with the widespread side of AGW alarm (AGWA, for short).  In that way it is hoped that all members of society can make informed decisions.

Highlighted Article: The Great Climate Change Debate: William Happer v. David Karoly

  • 9/6/18 at 06:00 AM

From: Watts Up With That?

By: Andy May

The Great Climate Change Debate: William Happer v. David Karoly - 4 part series

  1. Part A - September 1, 2018
  2. Part B - September 2, 2018
  3. Part C - September 3, 2018
  4. Part D - September 3, 2018


Karoly summarizes as follows:

“Science has established that it is virtually certain that increases of atmospheric CO2 due to burning of fossil fuels will cause climate change that will have substantial adverse impacts on humanity and on natural systems. Therefore, immediate stringent measures to suppress the burning of fossil fuels are both justified and necessary.”

Happer’s key point is:

“Climate models don’t work. They have predicted several times more warming from greenhouse gas increases than has been observed.”


  1. Part A - September 1, 2018
  2. Part B - September 2, 2018
  3. Part C - September 3, 2018
  4. Part D - September 3, 2018
Tags: Highlighted Article

Global Greening

A recent study by a multinational group of scientists has determined that: “From a quarter to half of Earth’s vegetated lands has shown significant greening over the last 35 years largely due to rising levels of atmospheric carbon dioxide”. The study results are based on analyses of data collected by NASA and NOAA satellites. The authors estimate that approximately 70% of the greening is the result of increased CO2 fertilization.

Operating commercial greenhouses under enhanced CO2 conditions to enhance plant growth is a very common practice. Typical greenhouse CO2 levels range from 1000 – 1200 ppm. There have been attempts made in the past to demonstrate aerial fertilization of field crops, but they have achieved limited or no success because of the rapid mixing and dispersion of the CO2 in the open atmosphere.

The increase in atmospheric CO2 concentrations over the past ~70 years, from approximately 270 ppm to approximately 400 ppm has created the opportunity to study the effects of CO2 fertilization on a wide variety of plants, including field crops, grassland species and forest trees. These studies have shown that increased atmospheric CO2 concentrations not only increase plant growth, but also increase the efficiency with which numerous types of plants use water. This has significant implications for areas which receive limited rainfall and are either unsuitable for growing crops or require irrigation for successful crop growth.

Critics have been quick to point out that: “the ultimate benefit to crops has been small — and it doesn’t explain our modern agricultural revolution. The driving factor has to be the fertilizers, the seed varieties, the irrigation”. While this criticism is certainly valid, it is not reasonable to expect that the effects of a 50% increase in atmospheric CO2 concentrations would be as dramatic as the further increase of ~200% imposed in modern commercial greenhouses. However, it is reasonable to assume that the increased atmospheric CO2 concentrations have been a contributing factor to improved crop production, though the effect is not separately measurable.

The development of crop seeds optimized for the higher atmospheric CO2 levels could impact not only the amount of fertilizer required but also the amount of water required for the successful growing of high yield field crops. These effects could potentially both expand the land area suitable for high yield crop production by increasing the efficiency of water use and reduce the cost of crop production by reducing fertilization costs.

Plant growth is a complex process affected by numerous variables. It is critical that these variables and their interactions are understood to optimize crop plant selection and production. The ongoing increase in atmospheric CO2 concentrations offers both the opportunity to study these interactions and the challenge of optimizing them for each of the important field crops over the range of growing conditions experienced around the globe.

Increasing global population will continue to challenge the efficiency and effectiveness of agricultural production. Increasing atmospheric CO2 concentrations will continue to play a role in meeting the challenge.

Tags: CO2 Emissions, Climate Science

Parsing The Washington Post on Climate

The Washington Post recently published an article entitled: Climate change is supercharging a hot and dangerous summer. The article has since also appeared in The Times-Picayune in New Orleans. The article is based on numerous broad, unsupported generalities.

The article begins with the assertion that: “This is a hot, strange and dangerous summer across the planet.” Summers are hot and hot weather can be dangerous, but that is hardly new or strange.

The article mentions wildfires in Greece and in Yosemite. It states that “scorching heat and high winds fueled wildfires”, though that is technically inaccurate, and implies that the heat and wind are exacerbated by climate change, though there is no evidence to support that implication.

The article goes on to state that: “The brutal weather has been supercharged by human-induced climate change, scientists say.” The “scientists” are not identified and there are numerous scientists who dispute such linkage.

The article also states that: “Climate models for three decades have predicted exactly what the world is seeing this summer.” While it is true that climate models have “predicted” (The IPCC now says: “projected”) warming for the past three decades, they have clearly not predicted “exactly” the situation this summer or any previous summer. The predominant climate model of three decades ago predicted more than twice the warming the globe is currently experiencing. The CMIP5 projections are also dramatically higher than current experience. Numerous scientists have recently acknowledged that the models are “running hot”. Clearly the article suggests an unjustified level of certainty.

The article further states that: “It's not just heat. A warming world is prone to multiple types of extreme weather - heavier downpours, stronger hurricanes, longer droughts.” The data does not support this assertion, as documented by Dr. Roger Pielke, Jr. Some scientists predicted permanent drought in the US southwest, though that prediction has been falsified.

The article quotes climatologist Katharine Hayhoe as follows: "You see roads melting, airplanes not being able to take off, there's not enough water". However, surface melting of blacktop road surfaces is not a new phenomenon related to climate change. It has been a fact of life in much of the US in summer for decades. To imply that it is a new phenomenon is intentionally misleading. While it has also been common for airlines to be required to reduce cargo loading and even passenger loading of their planes during summer in desert locations, the recent issue with flight cancellations in Phoenix is linked directly to a specific aircraft – the Bombardier Canadair Regional Jet (CRJ), which is only certified by the FAA for operation at temperatures below 118°F. The manufacturer made a series of economic decisions regarding the aircraft design and the purchasing airlines made a series of economic decisions regarding their aircraft selections. Water shortages in desert regions are hardly a new occurrence; and, they are exacerbated by growing populations in desert regions combined with inadequate preparation for water retention during “monsoon” periods in these locations.

The article also refers to the results of attribution studies as theory meets reality, though the attribution study results are hardly certain, as there are no observational data to support them. Model outputs are not reality.

Articles such as this are intended to promote an agenda. They do so by offering unsupported assertions as if they were facts. They do not advance understanding, though they can increase concern.


Tags: Climate Models, Climate History

Highlighted Article: The Fight Against Global Greening

  • 8/23/18 at 06:12 AM


From: Watts Up With That?

By: Kip Hansen

The Fight Against Global Greening - Series of 4 essays


  1. Part 1 - August 14, 2018
  2. Part 2 - August 15, 2018
  3. Part 3 - August 17, 2018
  4. Part 4 - August 19, 2018


Something odd happened between April 2017 and July 2018. I haven’t discovered exactly what prompted it but the rather good science writer and journalist, Carl Zimmer, seems to have flipped his wig. Well, at least he flipped his viewpoint on Global Greening.


In April 2017, Zimmer wrote a nice article for the New York Times titled “Antarctic Ice Reveals Earth’s Accelerating Plant Growth”. The article is a straightforward report on research performed by Dr. J. E. Campbell of the Sierra Nevada Research stitute, University of California in Merced, California (and others…) called “Large historical growth in global terrestrial gross primary production” published 5 April 2017 in the journal Nature.


Eric Worral did a WUWT news brief on the 30 July ’18 Carl Zimmer NY Times article. I thought the issue needed a little more attention — in fact, I thought it needed a series of four essays ...


  1. Part 1 - August 14, 2018
  2. Part 2 - August 15, 2018
  3. Part 3 - August 17, 2018
  4. Part 4 - August 19, 2018


Tags: Highlighted Article

Parsing the Environmental Defense Fund (EDF)

The Wall Street Journal recently published an opinion piece by Fred Krupp, the President of the Environmental Defense Fund (EDF). The piece was not accompanied by a disclaimer that the piece was the opinion of Mr. Krupp and did not necessarily represent the opinions of the EDF, so it is reasonable to assume that the piece is an EDF position.

The Krupp / EDF piece is both self-serving and misleading. It was written to advance the cause of imposition of a carbon tax in the US. It asserts that: “Climate change is a byproduct of the prosperity created by the market economy, …”. However, climate change predates the existence of any market economy anywhere on the globe. The earth’s climate has been changing, both warming and cooling, for the entirety of the history we have been able to study. It would have been accurate to assert that any anthropogenic component of climate change was, in part, a byproduct of the prosperity facilitated by the market economy.

The Krupp / EDF piece asserts that: “Public policy that puts a price on carbon emissions would speed adoption of clean energy by exposing the market to the costs this pollution puts on society.” The selection of the expression “carbon emissions” is intended to conjure an image of “dirty black stuff” polluting the atmosphere, rather than an image of an invisible gas which is known to absorb and reradiate infrared energy in the atmosphere. The piece suggests that sources of energy which emit carbon dioxide are not “clean-energy” because they emit carbon dioxide. The piece makes no reference to the positive impacts of increased atmospheric CO2 concentrations on global greening.

The Krupp / EDF piece asserts that: “Working with accurate scientific facts and the right incentives, the market will find winning solutions. So let’s follow the data and get this done.” However, the piece does not identify what it considers to be “accurate scientific facts”. Regrettably, the term “fact” is often used loosely in climate discussions. It is not likely that Krupp has ever seen the data he encourages us to follow. Rather, he has likely only seen “adjusted” data, which are merely estimates of what the data might have been had they been collected timely from properly selected, calibrated, sited, installed and maintained instruments. It is also unclear which version of the “accurate scientific facts” Krupp might have seen.

The Krupp / EDF piece asserts that: “Leading scientists’ predictions of temperature rise have been largely accurate.” While the predictions that temperatures would rise might have been accurate, the predicted magnitude of the rise was clearly not. Hansen’s “predictions” were high by a factor of approximately two. The “predictions” of the CMIP5 models have also been high by a factor of approximately two.

Prominent members of the consensed climate science community have recently acknowledged that the models are “running hot” and advocated for the establishment of a global temperature measurement network modeled after the USCRN (US Climate Reference Network), though Krupp fails to mention these facts.

Interestingly, while members of the consensed climate science community are referred to as “leading scientists”, scientists who question the consensus are merely referred to as “skeptics”.


Tags: Estimates as Facts, CO2 Emissions, Adjusted Data

Highlighted Article: Obama Carbon Colonialism and Climate Corruption Continue

  • 8/16/18 at 06:06 AM


From: Townhall

By: Paul Driessen and David Wojick


  1. PART 1 - August 11, 2018
  2. PART 2 - August 13, 2018
  3. PART 3 - August 14, 2018


It’s obscene enough when the Multilateral anti-Development Banks do it. But Trump agencies?!?

In a prime example of Deep State revanchism, despite the profound change in administrations, the US Agency for International Development is still funding and advancing anti-energy Obama-era climate change dogmas and policies for developing countries. USAID handles tens of billions of dollars a year, roughly half of all US foreign aid, so this climate alarmism puts literally millions of lives at risk.

USAID calls its “flagship” program “low emissions development.” Emissions of course means plant-fertilizing, life-giving carbon dioxide – but the term is intended to suggest dangerous climate changing pollution. The effect, if not the intent, is to deprive poor countries of the enormous life-enhancing benefits of abundant, affordable electricity and fossil fuels, which created the health and wealth Americans enjoy.


  1. PART 1 - August 11, 2018
  2. PART 2 - August 13, 2018
  3. PART 3 - August 14, 2018


Tags: Highlighted Article

Trump EPA Accomplishments & Challenges

The resignation of EPA Administrator Scott Pruitt and the appointment of Acting Administrator Andrew Wheeler presents an opportunity to review what has been accomplished at EPA and what challenges remain to be addressed.


Accomplished


  • “Secret Science”

Administrator Pruitt terminated the use of “secret science” by the EPA in the regulatory process. This decision raised concerns about the protection of information regarding individuals involved in the research projects. However, it is clear that the data, methods, analytical techniques and models used in the research can be made public to facilitate reproduction and validation without disclosing personal data of the participants.

EPA Ends The Use Of “Secret Science” In Crafting Regulations – Hot Air


  •  “Sue & Settle”       

EPA has terminated the use of the practice of “sue & settle” under which EPA assisted environmental activist groups in suing EPA, then settled the suits by adopting the regulations or practices advocated by the environmental groups.

Sue and Settle: Regulating Behind Closed Doors –US Chamber of Commerce


  • Paris Accords

President Trump notified the UN of the intent of the US to withdraw from the Paris Accords because the Accords uniquely disadvantaged the US; and, would ultimately be ineffective.

U.S. submits formal notice of withdrawal from Paris climate pact - Reuters


  •  “Green Climate Fund”

The US notified the UN that it would cease contributing to the UN Green Climate Fund. The GCF was intended to provide annual funding of ~$100 billion by 2020 to assist developing and not-yet-developing countries to reduce CO2 emissions. The Fund was slated to grow to $400-425 billion per year by 2030. The US contribution was to be ~25% of the total funding.

U.S. withdrawal from the Paris Agreement: Reasons, impacts, and China's response - ScienceDirect


  • EPA Advisory Panel

Administrator Pruitt dissolved the EPA Advisory Panel, which was constituted of scientists, many of whom were also funded by EPA grants, in an apparent conflict of interest.

U.S. Government Disbands Climate-Science Advisory Committee – Scientific American


Remaining


  • Clean Power Plan

EPA has stated an interest in repealing the Clean Power Plan, which effectively prevents the construction of new coal generating stations and requires the closure of many existing plants. The emissions levels required under the CPP would require installation and operation of carbon capture and storage technology which is not currently commercially available and appears to significantly reduce plant efficiency.

Electric Utility Generating Units: Repealing the Clean Power Plan: Proposal - EPA


  • Endangerment Finding   

Administrator Pruitt had expressed interest in re-evaluating and potentially reversing the 2009 Endangerment Finding regarding CO2. The finding was based on IPCC modeled outputs, which have now been demonstrated to be inaccurate.

Trashing EPA's endangerment finding would be tough – E&E News


  • UNFCCC (United Nations Framework Convention on Climate Change)

The US is required under current US law to exit the UNFCCC, since that body has recognized the Palestinian Authority as a “state level” participant. This action has not yet occurred.

Why the U.S. Should Clexit and Pexit—Exit UNFCCC and Paris Climate Treaty – Cornwall Alliance


  • Discontinue funding international climate efforts

The US continues to fund UN climate change activities through the UNFCCC. It appears that this funding will be terminated in the 2019 federal budget.

Trump Budget Would Cripple U.S. International Climate Change Work – Inside Climate News


  • Tiger Teams           

EPA should work with NOAA and NASA to launch tiger teams to conduct a detailed review of the climate change activities of those agencies. One focus of these teams would be the continual changes in the historical climate record by these agencies.

What is a Tiger Team Approach? - Trextel


  • Red Team - Blue Team

Administrator Pruitt advocated an open climate change debate using a Red Team – Blue Team approach. This open debate has not occurred and there is significant confusion regarding Administration support for such an effort.

Red team-blue team exercise will expose the junk science that filled Obama's EPA – The Hill


The Administration has accomplished much in its first 18 months, particularly at EPA under Administrator Pruitt. However, much remains to be done at EPA under the direction of Acting Administrator Wheeler.


“It ain’t over till it’s over.” - Yogi Berra, American philosopher


Tags: Clean Power Plan, Donald Trump, EPA, EPA Endangerment Finding, Red Team Blue Team Debate, Paris Agreement, United Nations

How Do We Scare Them About Climate Change Now?

Question:

What are the committed political science community, the consensed climate science community and the complicit media science community to do if the tens of millions of dollars spent on the creation of climate model based “scary scenarios” is not enough to scare the voting public into demanding drastic measures to save the planet from the projected “climategeddon”?

Answer:

Commit additional millions to fund additional studies to produce additional, even scarier scenarios to be broadcast with even greater feigned certainty of future devastation. What else?

The following is a mere sampling of the most recent “even scarier scenarios” intended to free us from our malaise and spur us into demanding action.

The consensed climate science community and their funders and cheerleaders apparently do not understand, or simply choose to ignore, that the voting public in the US has reached climate crisis saturation. Previous disaster predictions have failed to materialize, no matter how often and how hysterically the “Chicken Littles” have announced that “the sky is falling”.

Meanwhile, weather persists. Winter is cold, with snow. Summer is hot, with thunder storms. Floods and droughts occur. Hurricanes, tropical storms and tornadoes continue to form. Some climate scientists claim that anthropogenic climate change makes all of these weather events more frequent, more intense, more damaging and more life threatening. However, the data do not support such claims.

Of course, the creation of the “even scarier scenarios” has not stopped the creation of silly “scary scenarios”, such as those listed below.


Meanwhile, what we should be doing now remains undone. Climate data are still suspect, as the result of installation issues, “adjustment” and “infilling”. Climate models remain unverified and continue to “run hot”. Climate sensitivity is still undetermined. Cloud forcings are still uncertain. The differences between surface-based and satellite-based sea level rise measurements remain unresolved, as do the differences between near-surface and satellite temperature measurements.

These unresolved scientific issues are far more important that the “scary scenarios”, which are built on the unresolved scientific issues.

The current situation is reminiscent of the approach demanded by the Queen of Hearts in the trial scene from Alice’s Adventures in Wonderland, by Lewis Carroll”:

                                    “Sentence first – verdict afterward”

It seems hardly scientific and equally silly to demand “verdict first – evidence afterward”, as appears to be the case with current climate science, at least from the perspective of the political science community and their cheerleaders in the media.

However, when all else fails, there always remains the old trial lawyers’approach:

“When the facts are on your side, pound the facts. When the law is on

your side, pound the law. When neither is on your side, pound the table.”


Tags: Climate Science, Climate Change Debate, Climate Change Myths

Temperature Measurement Bias

The evolution of ambient temperature measurement technology has exposed several fundamental biases in the measurements taken to monitor changes in the climate. These biases must be quantified and compensated for to maintain the integrity of the historical temperature measurement record.

The US Climate Reference Network (CRN) is the most advanced network of ambient temperature measurement stations currently in use. The CRN stations were sited remotely to eliminate or minimize the potential impact of their surroundings on the representativeness of the ambient temperature measurements. Each station includes three high precision resistance temperature devices (RTDs) installed in fan aspirated radiation shield enclosures to assure constant air flow over the sensors, regardless of ambient wind conditions. The photo below shows a typical CRN location.


CRN Weather Station


Measurements taken by the CRN stations were compared with measurements taken with the Maximum Minimum Temperature Systems (MMTS) collocated with the CRN stations. These tests demonstrated significant measurement biases with the MMTS, particularly under conditions of high solar radiation and minimum ambient wind speed. These biases are believed to result from the fact that the MMTS relies on natural convection to induce air flow over the sensors. The MMTS are also subject to additional bias as the reflectivity of the enclosure degrades due to weathering and ultraviolet degradation. The photo below shows a typical MMTS.


MMTS Thermometer Enclosure


The MMTS came into common use for climate temperature measurement in the 1980s, replacing the Cotton Region Shelter (CRS) or Stevenson Screen with liquid-in-glass thermometers, which had been the measurement station of choice for most of the 20th century. The photo below shows a typical CRS.


CRS Thremometer Enclosure


The major disadvantages of the CRS include the requirement for a person to manually read the thermometers accurately at the proper time and the weather-driven deterioration of the reflectivity of the enclosure coating. The CRS produced biases are believed to result from its reliance on natural convection to induce air flow over the sensors and the heat storage capacity of the wooden box.

Measurements taken by CRN stations located relatively close to MMTS and CRS measurement stations are relied upon to verify the procedures used to correct for biases present in the MMTS and CRS stations. However, correcting known or suspected biased readings is less desirable than taking accurate readings in the first instance. This has recently resulted in calls for the development of a global land surface climate fiducial reference measurements network.

There has been a somewhat similar evolution in sea surface measurement approaches. Originally, sea surface temperature measurements were taken by lowering buckets of various construction from the decks of ships, allowing the buckets to fill with water, raising the buckets to the deck, immersing thermometers into the buckets to measure water temperature and then removing the thermometers from the water to read them and record the readings. This method was and is fraught with potential errors. More recently, many ships are equipped with temperature measuring devices located in the engine cooling water inlets. However, these readings are biased by the temperature conditions surrounding the cooling water inlets. Also, the water depth at which the samples are taken is a function of how heavily the ship is loaded, since the cooling water inlets must be located sufficiently below the Plimsoll line that they are beneath the water line when the ship is lightly loaded. Therefore, under normal operating conditions, the water temperature measured is not the surface temperature, but rather the temperature several feet below the surface, disturbed by the ship’s bow wake.

Deployment of drifting and moored buoys provides more accurate and reliable temperature measurement at the surface. These buoys have exposed the warm bias in the shipborne measurements. The more recent deployment of the Argo buoys has also facilitated measurement of sea temperatures at depth, providing valuable information regarding heat storage in the oceans.

The principal bias of the US CRN and the buoy-based measurements is accuracy. These stations are also used to check the accuracy of the satellite-based measurements, whose principal bias is comprehensive geographical coverage. These are highly desirable and valuable biases.


Tags: Temperature Record, US Climate Reference Network (CRN), Bias

Asymptotes

Atmospheric physics establishes that the impact of incremental additions of CO2 to the earth’s atmosphere approaches zero asymptotically, as shown in the graph below.

Heating Effect of CO2

This means that any increase in the global average surface temperature resulting from increased atmospheric CO2 must ultimately result in the global average surface temperature asymptotically approaching a limiting temperature, all other things being held equal, which of course they are not.

The general shape of the curves produced by the CMIP5 ensemble of climate models should therefore show an asymptotic approach to some temperature. That is clearly not the case, as shown in the graph below.


90 CMIP5 Climate Models vs. Observations


However, as shown in the graph, both the HadCRUT 4 near-surface temperature anomaly product and the UAH lower tropospheric temperature records do appear to be asymptotically approaching some limiting temperature, though the period shown in the graph is shorter than the 30-year period considered to represent climate. Since this graph was created in 2014 the annual observations have recorded a significant temperature anomaly spike resulting from a super El Nino and have now begun declining toward the paths they have followed since about 1998. The magnitude of the spike is attenuated by the 5-year means shown in the graph. The “x”s added to the graph are approximations of the 5-year means for both HadCRUT 4 and UAH. The super El Nino is not reflected in the model projections.

The graph below shows the future absolute temperatures projected by the ensemble of climate models, depending on the Representative Concentration Pathway (RCP) used for the analysis. The models show an asymptotic approach to approximately 15ºC around 2050, or an anomaly of approximately 1.5ºC, using RCP 2.6, then a slight decline by 2100. The absolute temperature asymptotically approaches approximately 16ºC in 2100 using RCP 4.5, or an anomaly of approximately 2.5ºC. The models do not begin to show an asymptotic approach to a temperature by 2100 using RCP 8.5; and, the approximate anomaly at that time has reached approximately 5ºC. RCP 8.5, fortunately, is showing itself to be unrealistic.


HadCRUT3v, CRUTEM3v, CMIP3 ensemble, CMIP5 ensemble


Absolute temperatures from climate model historical realizations and future scenarios. Black line is the HadCRUT3v blended land and ocean temperature dataset and red line is CRUTEM3v land-only temperatures [Brohan et al., 2006]. Blue lines are three historical realizations, while orange, green and brown are future RCP-scenario realizations with the MPI-ESM-LR model, and light gray lines are the first historical realization from each model found in the CMIP3 dataset [Meehl et al., 2007] and dark gray lines the corresponding CMIP5 historical realizations [Taylor et al., 2012]. Some model realizations were started later than 1850. The estimated Last Glacial Maximum temperature range of 4–7 K below present is from Intergovernmental Panel on Climate Change [2007].


Overview of representative concentration pathways (RCPs)


Descriptionª

Publication—IA Model

RCP8.5

Rising radiative forcing pathway leading to 8.5 W/m2 (~1370 ppm CO2 eq) by 2100.

(Riahi et al. 2007)—MESSAGE

RCP6

Stabilization without overshoot pathway to 6 W/m2 (~850 ppm CO2 eq) at stabilization after 2100

(Fujino et al. 2006; Hijioka et al. 2008)—AIM

RCP4.5

Stabilization without overshoot pathway to 4.5 W/m2 (~650 ppm CO2 eq) at stabilization after 2100

(Clarke et al. 2007; Smith and Wigley 2006; Wise et al. 2009)—GCAM

RCP2.6

Peak in radiative forcing at ~3 W/m2 (~490 ppm CO2 eq) before 2100 and then decline (the selected pathway declines to 2.6 W/m2 by 2100).

(Van Vuuren et al., 2007a; van Vuuren et al. 2006)—IMAGE

ª Approximate radiative forcing levels were defined as ±5% of the stated level in W/m2 relative to pre-industrial levels. Radiative forcing values include the net effect of all anthropogenic GHGs and other forcing agents


The growing difference between the model projections and the observations has highlighted the need to improve the climate models, including a reevaluation of the climate sensitivity estimates upon which the model projections are based. This should be a high priority for climate research in the future.


Tags: Climate Models, Temperature Record

Highlighted Article: Climate Change, Fossil Fuels, and Human Well Being

  • 7/19/18 at 07:18 AM

From: Competitive Enterprise Institute

By: Marlo Lewis

Climate Change, Fossil Fuels, and Human Well Being

"Climate campaigners demand ever-greater government control over energy markets, resources, and infrastructure. Many believe the best thing governments can do with fossil energy is “keep it in the ground.” They claim fossil-fueled civilization is “unsustainable” and headed for a climate catastrophe. Are they correct?"


Climate Change, Fossil Fuels, and Human Well Being


Tags: Highlighted Article

The Truth, the Whole Truth and… Climate Change

Thousands of near-surface temperature data points are collected globally each day. These data points are freely available to each of the global near-surface temperature anomaly producers: NOAA, NASA GISS, Hadley Center/UEA and the Japanese Meteorological Agency. Each of these anomaly producers selects from among the data, “adjusts” the data, homogenizes the data and, in the case of NASA GISS, “Infills” missing data. Each agency produces a monthly global temperature anomaly calculation based on this data.

The global temperature anomaly calculations differ among the agencies because of difference in the reference period, the data selected for inclusion, the “adjustment” process and possible “infilling” of missing data. The anomalies are reported to two decimal place “precision”, typically with an uncertainty band of +/- 0.10ºC. However, according to a study by Dr. Patrick Frank of the Stanford Synchrotron Radiation Lightsource/SLAC at Stanford University, the reported uncertainty bands “have not properly addressed measurement noise and have never addressed the uncontrolled environmental variables that impact sensor field resolution”.

The uncontrolled environmental variables which affect sensors in field locations in the United States were surveyed and reported upon by the Surface Stations Project. Dr. Frank’s analysis focuses on the effects of measurement noise. Dr. Franks concludes that, for the common MMTS sensor, the total noise plus resolution lower-limit 1σ measurement uncertainty in an annual temperature anomaly referenced to a 30-year mean is ±0.46ºC, for a well sited and maintained installation. He further estimates that issues with actual field installations in the Global Historical Climatology Network, “a globally complete assessment of current air temperature sensor field resolution seems likely to reveal a measurement uncertainty exceeding ±0.46ºC by at least a factor of 2.”

The significance of these uncertainties is illustrated in the following graph, in which the black line is the NASA GISS reported historical temperature anomaly, as reported in 2010; and, the gray area represents the measurement uncertainty of +/-0.46ºC about the reported historical temperature anomaly. “The trend in averaged global surface air temperature from 1880 through 2000 is statistically indistinguishable from zero (0)º Celsius at the 1σ level when this lower limit uncertainty is included, and likewise indistinguishable at the 2σ level through 2009.”

Assuming Dr. Franks is correct that actual field measurement uncertainty is =/> 2 x 0.46ºC, the gray area would be twice as wide as shown in the graph at the1σ level, rendering the trend in averaged global near-surface air temperature indistinguishable from zero (0)º Celsius through 2017.


Temperature Anomally

Dr. Franks concludes as follows:

“Future noise uncertainty in monthly means would greatly diminish if the siting of surface stations is improved and the sensor noise variances become known, monitored, and empirically verified as stationary. The persistent uncertainty due to the effect of uncontrolled microclimatic variables on temperature sensor resolution has, until now, never been included in published assessments of global average surface air temperature. Average measurement noise and the lower limit of systematic sensor errors combined to yield a representative lower limit uncertainty of ±0.46ºC in a 30-year mean annual temperature anomaly. In view of the problematic siting record of USHCN sensors, a globally complete assessment of current air temperature sensor field resolution seems likely to reveal a measurement uncertainty exceeding ±0.46ºC by at least a factor of 2. The ±0.46ºC lower limit of uncertainty shows that between 1880 and 2000, the trend in averaged global surface air temperature anomalies is statistically indistinguishable from 0ºC at the 1σ level. One cannot, therefore, avoid the conclusion that it is presently impossible to quantify the warming trend in global climate since 1880.


Finally, the relatively large uncertainty attending the global surface instrumental record means that the centennial temperature trend is not a precision target for validation tests of climate models. Likewise, the current surface instrumental record cannot credibly be used to train or renormalize any physically valid proxy reconstruction of paleo-temperature with sufficient precision to resolve any temperature difference less than at least 1ºC, to 95% confidence. It is thus impossible to know whether the rate of warming during the 20th century was climatologically unprecedented, or to know the differential magnitude of any air temperature warmer or cooler than the present, within ±1ºC, for any year prior to the satellite era. Therefore previous suggestions, that the rate or magnitude of present climate warming is recently or millennially unprecedented, must be vacated.”


These conclusions paint a very different picture of the state of our understanding of global temperature change than the anomaly changes reported to two decimal place “precision” by the producers of the global near-surface temperature anomaly products. They strongly support the arguments for development of a global land surface climate fiducial reference measurements network.


Tags: Global Historical Climate Network, Global Temperature, Temperature Record

Highlighted Article: Opening Up the Climate Policy Envelope

  • 7/12/18 at 06:33 AM

From: Issues in Science and Technology

By: Roger Pielke Jr.

Opening Up the Climate Policy Envelope

Fudged assumptions about the future are hampering efforts to
deal with climate change in the present. It’s time to get real.


Tags: Highlighted Article
Search Older Blog Posts