Call or complete the form to contact us for details and to book directly with us
435-425-3414
435-691-4384
888-854-5871 (Toll-free USA)


Contact Owner

*Name
*Email
Phone
Comment
 
Skip to Primary Navigation Skip to Primary Content Skip to Footer Navigation
▽ Explore More ▽ Hide

Climate and Climate Change

Climate and Climate Change

Climate Change

Two days before Halloween, 2011, New England was struck by a freak winter storm. Heavy snow descended onto trees covered with leaves.  Overloaded branches fell on power lines.  Blue flashes of light in the sky indicated exploding transformers.  Electricity was out for days in some areas and for weeks in others. Damage to property and disruption of lives was widespread.

That disastrous restriction on human energy supplies was produced by Nature.  However, current and future energy curtailments are being forced on the populace by Federal policies in the name of dangerous “climate change/global warming”.  Yet, despite the contradictions between what people are being told and what people have seen and can see about the weather and about the climate, they continue to be effectively steered away from the knowledge of such contradictions to focus on the claimed disaster effects of  “climate change/global warming” (AGW, “Anthropogenic Global Warming”). 

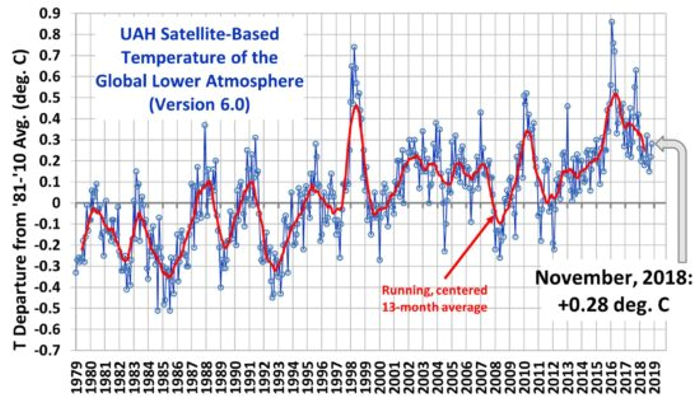
People are seldom told HOW MUCH is the increase of temperatures or that there has been no increase in globally averaged temperature for over 18 years.  They are seldom told how miniscule is that increase compared to swings in daily temperatures. They are seldom told about the dangerous effects of government policies on their supply of “base load” energy — the uninterrupted energy that citizens depend on 24/7 — or about the consequences of forced curtailment of industry-wide energy production with its hindrance of production of their and their family’s food, shelter, and clothing. People are, in essence, kept mostly ignorant about the OTHER SIDE of the AGW debate.

Major scientific organizations — once devoted to the consistent pursuit of understanding the natural world — have compromised their integrity and diverted membership dues in support of some administrators’ AGW agenda.   Schools throughout the United States continue to engage in relentless AGW indoctrination of  students, from kindergarten through university.  Governments worldwide have been appropriating vast sums for “scientific” research, attempting to convince the populace that the use of fossil fuels must be severely curtailed to “save the planet.”  Prominent businesses — in league with various politicians who pour ever more citizen earnings into schemes such as ethanol in gasoline, solar panels, and wind turbines — continue to tilt against imaginary threats of AGW.  And even religious leaders and organizations have joined in to proclaim such threats.   As a consequence, AGW propaganda is proving to be an extraordinary vehicle for the exponential expansion of government power over the lives of its citizens. 

Reasoning is hindered by minds frequently in a state of alarm.  The object of this website is an attempt to promote a reasoned approach; to let people know of issues pertaining to the other side of the AGW issue and the ways in which it conflicts with the widespread side of AGW alarm (AGWA, for short).  In that way it is hoped that all members of society can make informed decisions.

Unfinding Endangerment - Rescinding the Endangerment Finding

In a discussion on a recent comment thread, one commenter stated that “EPA had the evidence” when it issued its 2009 Endangerment Finding regarding CO2 and other “greenhouse gases”. Now, eight years later, the Endangerment Finding is being questioned by a new federal Administration and a new EPA Administrator. The courts, including the US Supreme Court, were involved in the determination that US EPA had the authority to regulate CO2 and other “greenhouse gases”  (GHGs) under the Clean Air Act. It is a virtual certainty that the courts, including the US Supreme Court, would be involved in any effort to rescind the Endangerment Finding.

This raises two obvious questions regarding the “evidence”:

  1. What evidence did EPA present in support of its Finding?
  2. Is that evidence still valid?

The evidence presented in support of the Endangerment Finding is described in the EPA Technical Support Document (TSD) published on December 7, 2009 and the reference documents listed in the document and its appendices. The primary evidence, based on observations, is that:

  • GHGs trap heat in the atmosphere.
  • Atmospheric concentrations of GHGs have increased.
  • Average ambient temperatures have increased.
  • Average sea surface temperatures have increased.
  • Average sea levels have increased.

From that evidence, the document proceeds to lay out Projections of Future Climate Change With Continued Increases in Elevated GHG Concentrations”. These projections are largely based on scenarios produced by general circulation models of the global environment, which were not then and are not now verified.

There is no question that the primary evidence, as listed above, is factual. However, there is reason to question whether the details of that evidence, particularly the temperature and sea level evidence, are factual. The near-surface temperature data are routinely “adjusted”, for a variety of reasons, before they are used to produce the various near-surface temperature anomaly products. The sea surface temperature data are also “adjusted”; and, temperature estimates are “infilled”, where actual data are not available.

There are far greater bases to question the “projections” made and suggested in the TSD. The potential future “endangerment” envisioned in the TSD is based on the historical rates of change of near-surface and sea surface temperatures and of sea levels; and, “projections” of future rates of change of these temperatures and sea levels, based on projections of future GHG emissions and their residence times in the global atmosphere.

The most widely recognized general circulation model, at the time of the Endangerment Finding, was the model developed by Dr. James E. Hansen of NASA GISS. The data input to this model is now 30 years old, the typical period identified by the World Meteorological Organization as the timeframe for “climate”. Therefore, it forms a reasonable basis for determining the accuracy of the “Predictions of Future Climate Change …” contained in the EPA TSD. A review of the scenarios produced by Hansen’s climate model can be found here.

Clearly, while GHG emissions have followed Hansen’s Scenario A, the temperature anomaly response has more nearly followed Hansen’s Scenario C, which envisioned a rapid cessation of global GHG emissions. Therefore, the “endangerment” envisioned in the 2009 Endangerment Finding is far less than was portrayed in the document. As a result, the regulations imposed and proposed by EPA might well be far more stringent that is justified by the actual impending “endangerment”, if “endangerment” actually impends.


Tags: EPA, EPA Endangerment Finding

Red Team / Blue Team – Public Climate Debate

EPA Administrator Scott Pruitt has proposed a formal Red Team / Blue Team exercise regarding climate change. However, the recent experiences with hurricanes Harvey and Irma have spontaneously initiated an informal Red Team / Blue Team exchange in the media and the blogosphere.

The informal Blue Team struck first, assisted by the media, with Dr. Michael Mann carefully opining that the hurricanes, while not caused by anthropogenic climate change, were at least made more severe as a result. Primary blame was assigned to warmer air and water temperatures, which would be expected to increase the quantity of moisture in the atmosphere, thus increasing the potential rainfall produced by hurricanes. Blame was also attributed to increased sea levels, which would be expected to increase the extent and impact of storm surge. Mann failed to distinguish between natural and anthropogenic climate change, though there is no indication that the relatively steady sea level rise over the past 150+ years is attributable to anthropogenic causation.


The media and numerous non-climate scientists were less careful, in one case (Eric Holthaus) declaring that “Harvey and Irma aren’t natural disasters. They’re climate change disasters.” Many were quick to criticize the Administration for withdrawing the US from the Paris Accords. The media, however, largely failed to mention that there had been a twelve-year period, prior to Harvey, during which no category 3 or greater hurricanes had made landfall in the US. They did, however, repeat frequent claims that climate change would make hurricanes more frequent, though these claims are based on unverified climate models.

The informal Red Team responded quickly, with publication of an e-book by Dr. Roy Spencer, a blog post by Dr. Neil Frank, and statements by Dr. Judith Curry and  Joseph Bastardi of Weatherbell Analytics, among others. Their messages were basically that climate change does not cause hurricanes; and, that there is no clearly established linkage between anthropogenic climate change and hurricane frequency or severity.

The NOAA Geophysical Fluid Dynamics Laboratory (GFDL), while it refers to several potential changes to tropical cyclone frequency and intensity in the future, based on modeled scenarios, provides the following conclusion based on current research:

“It is premature to conclude that human activities–and particularly greenhouse gas emissions that cause global warming–have already had a detectable impact on Atlantic hurricane or global tropical cyclone activity. That said, human activities may have already caused changes that are not yet detectable due to the small magnitude of the changes or observational limitations, or are not yet confidently modeled (e.g., aerosol effects on regional climate).”

NOAA GFDL goes on to discuss potential future impacts, based on unverified climate models. They suggest that global tropical cyclone intensity might increase by 2-11% by the end of the century. Even if this were to occur, it suggests that any existing change in global  tropical cyclone intensity is likely miniscule and probably undetectable. This stands in stark contrast to assertions such as “Harvey is what climate change looks like.”

As interesting as this informal Red Team / Blue Team exercise has been, it strongly illustrates the importance of a formal Red Team / Blue Team exercise. The truth lies somewhere; and, it would be nice to know where.

Tags: Red Team Blue Team Debate

Ground Rules for a Red Team / Blue Team Climate Debate

There is growing interest in a very public “Red Team / Blue Team” evaluation of the current state of climate science. The EPA Administrator has recently suggested that climate scientists participate in a televised debate regarding the state of the science. The “Blue Team”, the consensed climate science community, has dominated the climate change discussion and has largely refused to debate those who question or oppose the consensus. An open and rigorous debate of the issues regarding the science is long overdue. However, there is a need to establish a firm set of ground rules for the debate.

Dr. Judith Curry has recently presented ideas for framing the debate. She suggests that the debate must not be limited to anthropogenic climate change, but rather must be broadened to include all influences on climate, to the extent that they are known. This also implies a recognition of known unknowns and unknown unknowns, to paraphrase former US Secretary of Defense Donald Rumsfeld.

Perhaps the most crucial aspect of any set of ground rules for such a debate is the separation of fact from opinion, belief, and projection. In this debate, the facts include original data, data “adjustment” methods, data analysis methods, analytical models, and their supporting documentation. The ground rules should stipulate that nothing be accepted as fact that has not been freely available for analysis by other than the original analysts for at least one year prior to the debate.

The collection, “adjustment”, and analysis of data and the development and exercise of climate models by the “Blue Team” has been funded by the US federal government and other government agencies, including the IPCC. The members of the “Red Team” should not be expected to review and analyze the material developed by the “Blue Team” at their own expense. Rather, their efforts should be funded, as required, by the same agencies which funded the “Blue Team” efforts. Also, the “Red Team” must have sufficient time and resources to conduct a thorough analysis once all of the required information has been made available to them.

Refusal to provide unrestricted access to any body of work conducted by any researcher, or team of researchers, should be grounds to preclude any portion of that body of work from being introduced into the debate; and, should also preclude any of those researchers from participating in the debate. There is absolutely no excuse for refusal to provide unrestricted access to research funded by the government, at the request of the government, in pursuit of a government effort to establish the validity of the research results.

I question the potential value of a televised debate, in that even television news has degenerated into a collection of “soundbites” and “bumper sticker” slogans. TV panels made up of those with opposing views frequently descend into shouting matches, with the participants talking over each other, both to make their points and to deter their opponents from making theirs. The result is all too frequently “full of sound and fury, signifying nothing”.

A debate regarding the efficacy of billions of dollars of research and of public policy potentially affecting trillions of dollars of future investment in a thorough revision of the global economic system should not be permitted to degenerate into a shouting match loaded with unsupported opinion and innuendo. The taxpayers who have funded the research and would ultimately fund the investment deserve far better.


Tags: Climate Change Debate, EPA, Red Team Blue Team Debate, Taxpayer Funded Data and Studies

Hansen Revisited – Were the Climate Models Right?

The World Meteorological Organization typically defines climate as average weather over a period of 30 years. In climate science, then, it is useful to compare observed weather over a 30 year period with the scenarios of future climate produced by climate models, to assess the accuracy and predictive skills of the models.

Perhaps the most widely recognized climate model scenarios covering the period of 30 years ago until the present are the model scenarios produced by Dr. James E. Hansen of NASA GISS in the mid-1980s. These model scenarios were the subject of the now infamous Wirth / Hansen “warm hearing room” presentation to the US Congress in 1988. The graph presented by Dr. Hansen at this hearing is reproduced below.

Scenario A: Continued annual emissions growth of ~1.5% per year

Scenario B: Continued emissions at current (mid-1980s) rates

Scenario C: Drastically reduced emissions rates from 1990 – 2000

The ‘x’ labeled ‘1’ located at approximately June 2017 at 0.46oC is the current 0.21oC satellite global tropospheric temperature anomaly produced by UAH added to the anomaly of approximately 0.25oC shown in the graph above for 1980.

The ‘x’ labeled ‘2’ located at approximately June 2017 at 0.65oC is the current HadCRUT4 near-surface temperature anomaly.

Global annual CO2 emissions have continued to increase at approximately the 1.5% per year rate assumed by Dr. Hansen for his Scenario A, rather than leveling off at 1980 rates, as assumed for Scenario B, or declining drastically, as assumed for Scenario C. Global annual temperature anomalies, however, continue to be below the continued 1980s emissions level Scenario B (HadCRUT) or below the drastic reduction Scenario C (UAH).

The HadCRUT anomaly is currently approximately 0.40oC below the Scenario B level and approximately 0.6oC below the Scenario A level. The UAH anomaly is approximately 0.05oC below the Scenario C level, 0.6oC below the Scenario B level and 0.9oC below the Scenario A level. Clearly, the models and model inputs used by Dr. Hansen produced future climate scenarios significantly warmer than the actual climate for the period 1987 – 2017. However, we only have the luxury of that knowledge 30 years (one climate period) after the scenarios were produced.

It is likely that climate models have improved since the models used by Dr. Hansen in the mid-1980s. However, we will not be able to verify any improvement until scenarios produced by those models reach 30 years of age and can be compared against that same 30 years of observations. The model mean of the CMIP5 ensemble is still substantially warmer than any of the near-surface or satellite temperature anomaly products.

There is still no verified climate model; and, there is no climate model which has demonstrated predictive skill. Therefore, there is still no climate model which forms a reliable basis for major global or national climate change or economic policy. Clearly, that has not prevented, or even discouraged, the UN and most of its members from pursuing a modestly aggressive CO2 emissions reduction effort, with the goal of achieving zero net global annual CO2 emissions, if not by 2050, then certainly by the end of the century.


Tags: Climate Models

Who Stole My Warming – Problems With the Models

 “It doesn't matter how beautiful your theory is, it doesn't matter how smart you are. If it doesn't agree with experiment, it's wrong.” Richard P. Feynman

“Over 95% of climate models agree: the Observations must be wrong.” Roy Spencer

“Everything should be made as simple as possible, but not simpler.” Albert Einstein

A recent paper in Nature Geoscience by a gaggle of co-authors, including several well-known members of the consensed climate science community, analyzed “causes of differences in model and satellite tropospheric warming rates”.

Abstract

In the early twenty-first century, satellite-derived tropospheric warming trends were generally smaller than trends estimated from a large multi-model ensemble. Because observations and coupled model simulations do not have the same phasing of natural internal variability, such decadal differences in simulated and observed warming rates invariably occur. Here we analyse global-mean tropospheric temperatures from satellites and climate model simulations to examine whether warming rate differences over the satellite era can be explained by internal climate variability alone. We find that in the last two decades of the twentieth century, differences between modelled and observed tropospheric temperature trends are broadly consistent with internal variability. Over most of the early twenty-first century, however, model tropospheric warming is substantially larger than observed; warming rate differences are generally outside the range of trends arising from internal variability. The probability that multi-decadal internal variability fully explains the asymmetry between the late twentieth and early twenty-first century results is low (between zero and about 9%). It is also unlikely that this asymmetry is due to the combined effects of internal variability and a model error in climate sensitivity. We conclude that model overestimation of tropospheric warming in the early twenty-first century is partly due to systematic deficiencies in some of the post-2000 external forcings used in the model simulations.

The full paper is available from Nature Geoscience, but is behind a paywall, so it is not freely accessible.

The graphic below, form Dr. Roy Spencer, illustrates the situation discussed in the Abstract reproduced above.

Climate Models vs. Observations

Note that both the UAH Lower Troposphere and HadCRUT surface temperature trends begin diverging after 1998, the Hadcrut trend diverges more dramatically beginning in 2007. Dr. Spencer’s critique of an earlier Santer paper on the divergence is here.

It appears that the models were “fitted” to the “adjusted” surface anomalies through approximately 2000, though the authors do not state that this is the case. Beyond 2000, the “adjusted” surface temperature anomalies decline through 2012, then begin rising due to the effects of the 2015/2016 super El Nino.

The authors are careful to avoid use of the terms “hiatus” and “pause” in describing the measured temperature anomaly trends after 2000, even though the consensed climate science community has provided more than 60 potential explanations for the “hiatus”.

The abstract combined with the above graph make several very important points:

  • modeled warming is greater than measured warming in all but 2 models;
  • the difference between modeled warming and measured warming is very unlikely to be the result of natural variability in the climate alone, but is a clear indication that natural variability is at play;
  • the difference between modeled warming and measured warming is also unlikely to be the result of only natural variability plus a model error in climate sensitivity; and,
  • the difference between modeled warming and measured warming is most likely the result of a combination of natural variability, inaccurate climate sensitivity and inaccurate external forcings in the model simulations.

The clear conclusion is that the current climate models do not actually model the real climate. The authors acknowledge that this is likely the result of a combination of sensitivity and forcings errors in the model simulations. Numerous recent papers have suggested climate sensitivities near or below the lower end of the range of climate sensitivities identified by the IPCC. Also, Dr. Spencer has previously suggested that cloud forcing, assumed by the IPCC to be positive, is more likely negative. However, it is also likely that several aspects of climate, which are not well understood and therefore not included in the current models, are also at play in the differences between the measured and modeled anomalies.

A recent paper suggests that the “adjustments” to the near-surface temperature anomalies have increased their values by approximately 0.1oC. Were these “adjustments” to be reversed and the actual observed anomalies were used in the analysis, the gap between the modeled anomalies and the observed anomalies would widen from approximately 0.3oC to approximately 0.4oC.

It is also clear that the current model ensemble demonstrates no significant predictive ability; and, thus, should not form the basis for establishment of national or global climate policy. Further, it is clear that there is no “hockey stick” present in the temperature anomalies, which is interesting since Dr. Michael Mann is a co-author of the paper.


“Climate Science is the science of data that aren’t and models that don’t.” Ed Reid


Tags: Climate Models

Cost / Benefit Analysis in the Regulatory Process

The US federal government has taken numerous actions to require cost / benefit analyses, or cost effectiveness analyses, regarding federal rulemaking activities. The intent of these actions is to assure that the rulemaking activities provide real benefits at acceptable costs. However, this intent is violated when the regulatory agencies analyze only the costs, or only the benefits, of proposed actions.

One example of this violation of intent is the federal effort to establish the “Social Cost of Carbon”, specifically the supposed costs of increased atmospheric carbon dioxide concentrations on society. This effort has totally ignored the social benefits of increased atmospheric carbon dioxide concentrations, despite the well documented effects of enhanced carbon dioxide concentrations on the rate and extent of growth of the field crops used to produce food for people and animals. This effort has also ignored the greening of the globe, largely resulting from increased atmospheric carbon dioxide concentrations, recently documented by NASA, as well as the improvement of many plants’ ability to use available moisture efficiently.

Recent congressional testimony by Dr. Patrick J. Michaels, Director of the Center for the Study of Science at the Cato Institute, suggests that the social benefits of increased atmospheric carbon dioxide concentrations might well exceed the social costs, now and for the foreseeable future. If Dr. Michaels is correct, the recent federal efforts to establish the “Social Cost of Carbon” have been misguided, arguably deceptive and, ultimately, worse than useless.

Another example is provided in a recent article by Professor Michael Giberson of Texas Tech and Megan Hansen, Director of Policy at Strata. The federal government has focused heavily on the benefits of wind and solar generation as part of its climate change efforts; and, has provided substantial subsidies and incentives to encourage wider implementation of these technologies. However, relatively little effort has been made to identify the costs of these efforts, both direct and indirect.

The article highlights the renewable industry reaction to a recent study of electric grid reliability requested by Secretary of Energy Rick Perry. The study will examine the costs to the electric utility and its customers resulting from early retirements of baseload generating facilities and from the investments required to adapt the electric utility grid to increased reliance on intermittent renewable sources of electricity. The ability of the electric utility grid to operate reliably as the share of intermittent renewable electricity increases is dependent upon the availability of economical and reliable grid-scale electricity storage technology, which is not currently commercially available.

The intent of cost / benefit analysis requirements can also be violated by assigning unreasonable and/or unsupportable costs to activities or emissions. Perhaps the classic example of this type of violation is the US EPA estimate of the “Societal Cost of a Life Unnecessarily Shortened” at ~$9 million, regardless of the age of the person whose life is shortened, to justify new or more stringent environmental regulations. Such a determination is unsupportable, if for no other reason, because there is no basis on which to judge the relative cost to society of the premature death of an infant and of an elderly person. The use of an estimated societal cost of this magnitude makes it possible to “justify” extremely costly solutions to relatively trivial or non-existent issues.

Cost / benefit analyses must be comprehensive and objective to be useful. Apparently, much of recent cost / benefit analysis effort does not pass this test.


Tags: Cost of Carbon, Solar Energy, Wind Energy, Regulation

“It’s the Law of the Land” – UN Agencies Recognizing the Palestinian Authority

The United States Congress passed legislation in 1990 (Public Law 101-106) and 1994 (Public Law 103-236) prohibiting funding for United Nations “specialized agencies” and “affiliated organizations”. This legislation was signed into law by Presidents George H. W. Bush and William J. Clinton respectively.

The UN was aware of these laws when it extended participation in UNESCO (a UN “specialized agency”) to the Palestinian Authority in 2011. This UN action led to termination of US funding to UNESCO which represented ~22% of the UNESCO budget.

The UN was also aware of these laws when it extended membership in the UNFCCC (a UN “affiliated organization”) to the Palestinian Authority in 2016. This UN action, however, did not lead to termination of US funding to UNFCCC, as required by law. Rather, the Obama Administration requested $13 million in funding for the UNFCCC in 2017; and, provided $1 billion in funding for the UNFCCC’s Green Climate Fund, without specific congressional authorization and appropriation.

That was then. This is now. The “climate” regarding climate change has changed.

Now that the US has announced its withdrawal from the Paris Agreement, which is a creature of the UNFCCC, there appears to be no compelling reason for the US Administration to avoid following US law and to not defund UNFCCC and the associated Green Climate Fund. Arguably, there is no compelling reason for continued US participation in UNFCCC, since its sole focus is implementing the Paris Agreement and the associated Green Climate Fund.

The UN appears to need to be reminded periodically that it is not a global government with sovereignty over the sovereign nations of the world. The UN also appears to need to be reminded periodically that its actions have consequences when they conflict with the laws in place in its member nations.

It is long past time to instill a sense of humility into the UN bureaucracy. Defunding “specialized agencies’ and “affiliated organizations” as required by US law is a necessary, though likely not a sufficient, first step in the process.

Tags: United Nations, Paris Agreement, Green Climate Fund

Urban Heat Island Effect

Urban Heat Island

U.S. EPA--https://www.nsf.gov/news/mmg/mmg_disp.jsp?med_id=75857&from=mn

The above graphic from Lawrence Berkeley National Laboratories (U.S. EPA) clearly illustrates one aspect of the Urban Heat Island (UHI) effect – the impact of urbanization on late afternoon temperatures. The graphic depicts a 7oF elevation of downtown temperature relative to the temperatures in surrounding rural areas. This temperature elevation is the result of multiple factors, including decreased albedo, localized heat emissions, and wind blocking.

The UHI effect also manifests as warmer nighttime temperatures, primarily as the result of heat retention in downtown buildings and roads, combined with wind blocking. The nighttime warming can significantly exceed the daytime effect.

The UHI effect is clearly anthropogenic, though it is not the result of increased CO2 concentrations in the atmosphere. Human construction of cities, towns and villages, commercial areas and industrial parks has an obvious impact on the local climate, though a far lesser impact on global climate, since cities occupy on approximately 3% of global land area.

Numerous groups are involved in efforts to slow or halt urban sprawl. However, as the above graphic indicates, increased population density drives the UHI effect. It would be reasonable to expect that further increasing population density would cause the temperature difference between downtown areas and the surrounding rural areas to increase.

The graphic does not include an airport, though most larger cities are served by one or more airports. This is a significant omission from a climatological standpoint, since approximately half of all measuring stations in the Global Historical Climatology Network (GHCN) are located at airports. While airports are not affected by wind blocking to the same extent as the downtown areas in cities, they are affected by both decreased albedo and localized heat emissions. The primary purpose of the Automated Weather Observing System (AWOS), the Automated Surface Observing System (ASOS), and the Automated Weather Sensor System (AWSS) at airports is to provide local weather information in the interests of safe and efficient aviation operations. One of the primary aviation concerns is maximum temperature, since it affects both aircraft engine thrust and aerodynamic lift of the wing surfaces.

These automated airport weather stations are being used increasingly for climate related data acquisition because they are available and are well maintained. However, they are not ideally located for climatological measurement purposes.

Climate Reference Network Rating Guide - adopted from NCDC Climate Reference Network Handbook, 2002, specifications for siting (section 2.2.1) of NOAA's new Climate Reference Network:

Class 1 (CRN1)- Flat and horizontal ground surrounded by a clear surface with a slope below 1/3 (<19deg). Grass/low vegetation ground cover <10 centimeters high. Sensors located at least 100 meters from artificial heating or reflecting surfaces, such as buildings, concrete surfaces, and parking lots. Far from large bodies of water, except if it is representative of the area, and then located at least 100 meters away. No shading when the sun elevation >3 degrees.

Class 2 (CRN2) - Same as Class 1 with the following differences. Surrounding Vegetation <25 centimeters. No artificial heating sources within 30m. No shading for a sun elevation >5deg.

Class 3 (CRN3) (error >=1C) - Same as Class 2, except no artificial heating sources within 10 meters.

Class 4 (CRN4) (error >= 2C) - Artificial heating sources <10 meters.

Class 5 (CRN5) (error >= 5C) - Temperature sensor located next to/above an artificial heating source, such a building, roof top, parking lot, or concrete surface."

These airport weather stations offer the advantages of state-of-the-art measuring instruments, continuous measurement and frequent recalibration. However, they require “adjustment” of the data for climatological purposes, to reduce or eliminate the effects of the surrounding buildings, runways, taxiways and aircraft engine exhaust.

When assessing the validity of climatological temperature measurements, it is important to ask one simple question: “Where is the measuring station?” The answer affects the validity of both the maximum and minimum temperature measurements.


Tags: Urban Heat Island

Chinese Climate Leadership

Numerous recent articles have asked questions in this general form: “Will America Let China Lead the World?” These articles suggest that the US had the leadership role on climate change and that US withdrawal from the Paris Agreement will somehow cede the leadership role on climate change to China. These articles are based on highly questionable assumptions. Their primary intent, prior to the US withdrawal, was to shame the new Administration into remaining in the Agreement. Their primary intent, since the US withdrawal, is to shame the Administration into reversing its decision to withdraw.

The first questionable assumption is that the U.S. had a leadership role in climate change and the establishment of the Paris Agreement. The Rio Earth Summit, the United Nations Framework Convention on Climate Change (UNFCCC) the Intergovernmental Panel on Climate Change (IPCC) and the long series of Conferences of the Parties have all been UN activities, aided and abetted by environmental organizations and Non-Government Organizations (NGOs). While US diplomats and scientists have been involved in these activities, they have generally not been in leadership roles.

Specifically, in the case of the Paris Agreement, the US took President Obama’s preferred posture of “leading from behind”. The intent of the majority of the nations which participated in the creation of the Paris Agreement was the establishment of a treaty, which would be binding upon all of the signatory parties, both as to emissions reductions and contributions to the UN Green Climate Fund.

The US delegation was unwilling to enter into the agreement as a treaty, since President Obama was convinced that the US Senate would not ratify the Agreement as a treaty. Thus, rather than leading the effort envisioned by the Agreement, the US resisted the direction preferred by the other participants and forced compliance with the terms of the Agreement to be made voluntary as a condition of US participation. The US also insisted on the provision that nations be permitted to withdraw from the Agreement, which President Trump recently exercised.

The second questionable assumption is that China would ascend to the leadership role on climate change. China’s commitment under the Agreement with regard to emissions reductions is that China would begin reducing its CO2 emissions by about 2030, though it expressed its intent to reduce its “carbon intensity” in the interim. That could hardly be construed as a leadership position in an agreement intended to achieve reductions in CO2 emissions. China’s current primary focus is on economic development and reduction of criteria pollutant emissions (SOx, NOx, and particulates) from its existing coal power generation infrastructure, to reduce hazardous and obnoxious air pollution in its cities.

China is also a participant in the Group of 70 plus China, which is demanding funding from the UN Green Climate Fund. China has made no funding commitment to the Green Climate Fund; and, thus, is hardly in a leadership role regarding the Fund.

The third questionable assumption is that the other national participants in the Paris Agreement would accept China’s leadership, should China attempt to exert leadership within the Agreement. This is especially questionable as long as China is only committed to following along behind with regard to CO2 emissions reductions.

The fourth questionable assumption is that the UN, environmental organizations and NGOs which currently lead the climate change efforts under the Agreement would be willing to cede their leadership roles to China. These organizations all have visions of Climate Fund $ billions “dancing in their heads” and would likely be reluctant to cede control of their visions.


Tags: Paris Agreement, China

Virtue Signaling When Responding to Climate Polls

“Virtue Signaling refers to the public expression of an opinion on a given topic primarily for the purpose of displaying one’s moral superiority before a large audience to solicit their approval.”, Know Your Meme

“Seven out of 10 Americans supported remaining in the (Paris) agreement, according to a national poll conducted by the Yale Program on Climate Communication after the election.”

I suspect the results of this Yale poll and others are an example of virtue signaling by members of a populace which has been inundated with “climate consensus”, “future climate catastrophe”, “carbon pollution”, “more and stronger storms”, “more longer severe droughts”, “increased desertification”, etc. The poll questions are structured to invite virtuous responses; and, nobody wants more “pollution”.

The poll questions rarely identify the costs of remaining in the agreement, now and in the future. The possibility that electricity costs would double, or more, as the globe moved towards zero net CO2 emissions, as President Obama suggested, is not part of the background to the poll questions. The per capita tax increase required to fund the US share of the Green Climate Fund, either at the initial $100 billion per year funding level, or at the post-2030 $425 billion per year funding level, is also not part of the background to the poll questions.

Even at that, previous experience with polls asking whether individuals would spend “X” more for some good or service if it provided “Y” benefits suggests far higher positive response to the poll questions than the positive response when those same individuals are asked to “write the check”. In the case of US participation in the Paris Agreement, the “check” could be very large indeed. The capital investment required to reach zero net CO2 emissions in the US would be approximately $30 trillion.

US annual residential electric bills range from ~$1000 – 1800, or from ~$0.09 – 0.21 per kWh. The prospect of spending an additional $1000 – 1800 per year for the same quantity of electricity would be expected to dampen the enthusiasm of many consumers. The prospect of even higher costs as electricity replaced petroleum for transportation uses and natural gas for residential, commercial and industrial direct uses is hardly ever discussed.

The additional tax burden on US taxpayers to provide the intended ~25% US share of the initial annual funding of $100 billion for the UN Green Climate Fund would be ~$75 for each man, woman and child in the US (~330,000,000), or ~$150 for each man, woman and child in families which actually pay income taxes (~165,000,000). That tax burden would increase to ~$600 for each man, woman and child in families which pay income taxes after 2030, when annual funding for the Green Climate Fund would be expected to rise to ~$425 billion per year.

Pollsters don’t bother to remind poll respondents of the TANSTAAFL principle.

“There Ain’t No Such Thing As A Free Lunch.” 

Many poll respondents don’t think about the principle when they respond to poll questions.

In the case of the Paris Agreement, specifically the Green Climate Fund, most also ignore yet another principle.

“The Better Lunch Is, The More It Costs.”

Even though participation in the Paris Agreement is “voluntary”, its intent is not. Rather, its intent is that participants are progressively “sucked in”, which leads to a third principle which is also not often mentioned.

“Once You Start Eating, You Can’t Stop.”

These principles are also described in game theory as:

“You can’t win.”

“You can’t break even.”

“You can’t quit the game.”

President Trump has decided that the US, as a nation, will not participate in this game. States, cities and corporations which wish to play the game would be wise to do so outside of the Agreement, lest they discover that their participation becomes their own “Hotel California”. 

Last thing I remember, I was

Running for the door

I had to find the passage back to the place I was before

'Relax' said the night man

'We are programmed to receive'

You can check out any time you like

But you can never leave!

            (DON FELDER, DON HENLEY, GLENN FREY)

The developing and not-yet-developing nations of the world would also be wise to contemplate the price of the “free lunch” they are demanding from the Green Climate Fund on their future freedom. However, that is a story for another day.


Tags: Paris Agreement, COP 21, Green Climate Fund, CO2 Emissions, Polling

Climate Linguistics

Linguistics: “the study of human speech including the units, nature, structure, and modification of language”

Climate discussions have had some interesting impacts on linguistics, though it would be inaccurate to refer to those impacts as contributions to linguistics. Climate discussions have modified the meanings of words, not to clarify elements of the discussion, but rather to obfuscate. Climate discussions have also modified the language by adding new phrases to describe perceived actions or attitudes.

I have previously discussed the various applications of the word “denier” and its variants in climate discussions. The term is typically used derisively and inaccurately to refer to someone who questions the consensus climate orthodoxy. In this time of “sound bite” and “bumper sticker” communications, the term is handier than taking the time and effort to explain skepticism as it relates to climate. Its obvious allusion to Holocaust “denial” is both derisive and dismissive. It elides the distinction between denial of a historical fact with skepticism regarding a hypothesis.

I have also previously discussed the differences between facts (data) and beliefs (estimates) in climate discussions; and, the difference between potential future scenarios and predictions in climate modelling. Again, it is common in climate discussions to use terms which imply unjustified certainty, rather than to make the effort to provide a clear understanding of the state of the science. It seems strange to argue that the audience does not, or would not, understand the distinctions when no effort has been made to explain the distinctions.

The environmental community has taken upon itself the responsibility and authority to define what are the appropriate behaviors to be followed by various groups regarding the environment and the climate, as well as the responsibility to identify and vilify those who are not demonstrating those appropriate behaviors.

Numerous companies have begun advertising their sensitivity to the environment, sustainability and climate; and, establishing very visible programs demonstrating their commitment to the environment, sustainability, and climate. However, if the environmental community judges the advertised efforts to be insufficient, they have applied the new term greenwashing to those efforts, to convey their judgement that the efforts are less than they appear to be, or less than they need to be. The environmental community then frequently begins greenshaming (another new term in the lexicon) to coerce the companies to adopt more “appropriate behaviors”.

This has also led numerous companies and individuals to begin practices which have been assigned the new term virtue signaling. Most virtue signaling is verbal, though some extends to the physical. One the most obvious and most humorous examples of physical virtue signaling is the installation of insignificantly low capacity wind turbines in highly visible commercial locations, such as automobile dealer’s lots. The same might be said of insignificantly low capacity, but high visibility solar collector installations. Some have even suggested that the purchase and use of very expensive or significantly range limited electric vehicles is a form of virtue signaling.

Recently, after the announcement of the US withdrawal from the Paris Agreement, former New York City mayor Michael Bloomberg announced his intent that Bloomberg Philanthropies would donate $15 million to the UNFCCC to replace the US share of its operating expenses. This was most certainly an exercise in virtue signaling, as well as an effort to embarrass and greenshame the Trump Administration.

There appears to be an intellectual disconnect between the choice to use certain existing words inappropriately and inaccurately to convey contempt and the choice to create new terms for essentially the same purposes. Language has not obviously become more precise as a result, though it has become a bit more colorful.


Tags: Estimates as Facts, Climate Change Debate, Climate Science, Adjusted Data

Climate Research Priorities

Tracking changes in Earth’s climate is important. Climate change measurement is a unique challenge, because the experiment is ongoing, as it has for billions of years. Also, the experiment cannot be rerun if there is a measurement problem, because each day is unique. This means that instrument accuracy and reliability are essential; and, that the instruments must be placed carefully, to ensure that they are measuring the correct conditions or events. In addition, the changes being measured are quite small, so the measurement approach must ensure that the act of measuring the changes does not alter the conditions being measured.

The US Climate Reference Network (US CRN) satisfies the requirements discussed above, but only for the US. The satellite measurements also satisfy those requirements globally. However, the Global Historical Climate Network (GHCN), which provides the measurements used to produce the temperature anomaly products maintained by NOAA/NCEI, NASA GISS, Hadley Centre and others does not satisfy those requirements. Measurement station accuracy is known to be persistent problem, as is measurement station location. Many station locations have been compromised by progressive urbanization. Other locations were compromised when they were installed, such as those on or adjacent to buildings or those installed at airports. The time has come to abandon the GHCN.

The calibration of the satellite measuring systems are regularly checked against deep space temperature and the temperatures measured by balloon-mounted radiosondes. Satellite land surface temperature measurements can also be checked against the measurements taken by the US CRN; and, could be checked against measurements taken by similar installations at other locations around the globe, if and when such installations exist. Satellite sea surface temperature measurements are routinely checked against measurements taken by buoys deployed across the world’s oceans. It is also time to abandon collection and analysis of sea surface temperature measurements taken by sensors in the engine cooling inlets of ocean going vessels, or by lowering buckets over the sides of ships to collect water samples for measurement.

The satellite measurements are far more comprehensive geographically, far more accurate than most ground-based temperature measurements, and far less influenced by progressively changing conditions on the ground. The satellites also primarily measure changes in the temperature of the troposphere, where heat energy accumulating in the atmosphere is stored.

However, as important as tracking changes in the earth’s climate is, the more important issue in climate change research is developing an understanding of both the natural and the anthropogenic factors which affect the climate. This is essential to developing a model of the climate which actually models how the climate would respond to various changed conditions, of which increased atmospheric CO2 concentration is one of many. Current climate models do not actually model the real climate well. This is hardly surprising, since many factors and events which affect climate are not well understood; and, thus, not included in the current climate models.

The primary factors which drive current climate models are climate sensitivity to CO2 and various forcings, including clouds. There is no experimentally established value for climate sensitivity, which is why values ranging from 1.5 - 4.5ºC per doubling of CO2 concentration in the atmosphere are used in model runs, rather than a single, experimentally determined value. Likewise, it is not even certain whether the forcing associated with clouds is positive or negative. Exercising climate models using a range of values for their primary drivers produces a wide range of potential future scenarios. However, none of these climate models have been validated, nor are they likely to be, as long as they do not include the range of significant natural factors which have affected global climate throughout the ages. These factors include El Nino Southern Oscillation, the Pacific Decadal Oscillation, and The Atlantic Multi-decadal Oscillation.

Current models also do not account for the effects of solar events or changes in solar activity of emissions. This is a particularly significant omission, since solar activity is the source of virtually all the energy which heats the earth and its atmosphere. It seems inconceivable that a climate which accurately models the real climate is possible without appropriate treatment of solar influences.

Therefore, the primary focus of climate research must shift to understanding and quantifying all the significant factors which affect the climate; and, to using that knowledge to develop a climate model which actually models the real climate. Once this model has been developed and verified, the more difficult task of determining whether the model has any forecasting effectiveness can begin.

It seems ludicrous to believe that we can accurately model an extremely complex system we do not understand. It seems at least equally ludicrous to believe that we can control an extremely complex system that we do not understand. It seems even more ludicrous to believe that we can understand how that extremely complex system would react in the distant future, if we cannot understand how it reacts now.


Tags: Temperature Record, Global Temperature, Satellites, Climate Models, US Climate Reference Network (CRN), Global Historical Climate Network (GHCN)

Green Climate Funding

Numerous US corporations have stated that they are committed to efforts to mitigate climate change. Many of these corporations encouraged President Trump to remain in the Paris Agreement, which would include maintaining / increasing funding for the Green Climate Fund. These corporations apparently envision the potential to grow their businesses by offering their products and services to the developing and not-yet-developed countries, which would be recipients of climate change mitigation and adaptation funding from the Green Climate Fund.

This suggests a potential alternative source of US funding for the UN Green Climate Fund. US Corporations which have expressed commitment to mitigating climate change (and envision potential market development opportunities resulting from funding available through the UN Green Climate Fund) could provide funding directly to the Green Climate Fund. These funds could be provided from net profits, perhaps shared between retained earnings and dividends, with the approval of shareholders. Alternatively, the US federal government might choose to permit these contributions to be treated as market development expenses, which would make them tax deductible business expenses, which would transfer a maximum of 35% of the contributions to all taxpayers.

These corporations might make these contributions on the condition that the corporations manage the allocation of the funds to the recipient nations, consistent with the guidelines adopted for the Green Climate Fund. This would allow the corporations to use their management skills and experience to maximize the benefits of their funding for the recipients and their corporate interests. It would also avoid surrendering control of the funds to the opaque and demonstrably incompetent UN bureaucracy. Direct corporate involvement could also dramatically reduce the potential for funding to be siphoned off by the governments of the recipient nations.

The following US corporations directly encouraged President Trump to remain in the Paris Agreement.

Corporation

Oper. Income ($M)

Net Income ($M)

1% of Gross ($M)

1% of Net ($M)

Adobe

903

629

9

6

Apple

71,230

53,395

712

534

Facebook

12,427

10,217

124

102

Gap

1,191

676

12

7

Google

15,403

12,733

154

127

Hartford

804

896

8

9

HP

2,496

2,279

25

23

Ingersoll Rand

1,572

1,492

16

15

Intel

12,874

10,316

129

103

Johnson Controls

6,447

1,679

64

17

Levi Strauss

462

291

5

3

Microsoft

20,182

16,798

202

168

Morgan Stanley

8,848

6,123

88

61

PG&E

2,181

1,402

22

14

Schneider Elec.

2,951

1,811

30

18

TOTAL


1600

1207


The table above demonstrates that a 1% allocation of after tax net income by the listed corporations could provide annual funding of $1.21 Billion per year to the UN Global Climate Fund; and, that a 1% allocation of gross revenues could provide annual funding of $1.6 Billion to the Green Climate Fund. Other large US corporations have also expressed support for the Paris Agreement.

Total net income of US corporations is approximately $1.8 trillion Therefore, it is reasonable to assume that contributions from US corporations could yield $5 - 20 billion for the UN Climate Fund. The question is whether US corporations are willing to put their money and their shareholders’ money on the line.

The US withdrawal from the Paris Agreement does not inhibit these corporations from making such contributions; and, US government treatment of these contributions as business expenses could offset a portion of the contributions. The Administration might consider encouraging major US corporations to make such contributions.


Tags: Green Climate Fund

Paris Paranoia – The results of the U.S. withdrawal from the Paris Climate Agreement

Much has been said and written about the anticipated effects of President Trump’s decision to withdraw the US from the Paris Climate Accord. Several US cities and states have announced their intention to conform to the CO2 reduction targets agreed to by President Obama in the Paris Accord. Several corporations have also announced their intent to continue pursuing CO2 emissions reductions in line with the previous US voluntary commitment.

Some have described these statements as defiance of President Trump’s decision to withdraw the US from the Paris Accord. However, nothing in President Trump’s statement in any way prevents or inhibits US cities and states, or US Corporations from pursuing climate change related actions which they believe are in their enlightened self-interest. Therefore, while these statements certainly express disagreement with Trump’s decision, they do not represent defiance. They merely express a willingness to move forward on their own, as they were free to do before the Paris Accord was ratified, after it was ratified, and after the US withdrawal.

There are significant differences in the positions of these entities and the position of the US as a nation with regard to the Accord. President Obama obligated the United States to achieving a 26-28% reduction in US CO2 emissions by 2030; and, expressed the nation’s intent to reduce US CO2 emissions by 80% by 2050. President Obama also obligated the United States to provide approximately 30% of the funding for the UN Green Climate Fund, which was to provide an initial $100 billion per year to fund adaptation to and mitigation of the adverse effects of climate change on developing and not-yet-developing nations. The UNFCCC expected this climate funding to increase to approximately $400 billion per year.

US cities, states, and corporations are not and will not be signatories to the Paris Accord. Therefore, they have not obligated themselves to achieving specific CO2 emissions reduction levels by 2030 or 2050. They have also not committed themselves to contribute to the Green Climate Fund. Arguably, they are less obligated as the result of the US withdrawal from the Accord, as they would have been obligated by the US federal government to achieve some portion of the overall US reduction target. Also, as US taxpayers, they would have been obligated to provide their share of the US contribution to the Green Climate Fund.

President Trump offered to consider renegotiation of the Paris Accord, or negotiation of a new Accord which would be fairer to US taxpayers. However, both France and Germany have stated that there would be no such negotiations. Regardless, the US is now free to proceed to deal with the issue of climate change as it sees fit. That means that ongoing efforts to improve energy efficiency, implement renewable energy for power generation and alternative fuels for transportation can continue apace. State energy commission and utility commission renewable portfolio standards programs and renewable energy incentives can continue or expand.

Essentially, the only effects of the US withdrawal are the shedding of the national compliance and funding obligations in the Paris Accord and avoidance of the limitations to US national sovereignty embodied in the Accord. US citizens, cities, states and the US as a nation can now plan for their future actions regarding climate change without looking over their shoulders to see who’s after them.


Tags: Paris Agreement, CO2 Emissions, COP 21

Highlighted Article: On the Validity of NOAA, NASA and Hadley CRU Global Average Surface Temperature Data & The Validity of EPA’s CO2 Endangerment Finding

  • 7/7/17 at 10:43 AM

June 2017 research report from Dr. James P. Wallace III, Dr. Joseph S. D’Aleo, and, Dr. Craig D. Idso  that concludes: Temperature adjustments account for ‘nearly all of the warming’ in government climate data.

“... it is impossible to conclude from the three published GAST data sets that recent years have been the warmest ever – despite current claims of record setting warming,”


On the Validity of NOAA, NASA and Hadley CRU Global Average Surface Temperature Data & The Validity of EPA’s CO2 Endangerment Finding


Tags: Highlighted Article
Search Older Blog Posts