
Climate Change

Two days before Halloween, 2011, New England was struck by a freak winter storm. Heavy snow descended onto trees covered with leaves. Overloaded branches fell on power lines. Blue flashes of light in the sky indicated exploding transformers. Electricity was out for days in some areas and for weeks in others. Damage to property and disruption of lives was widespread.
That disastrous restriction on human energy supplies was produced by Nature. However, current and future energy curtailments are being forced on the populace by Federal policies in the name of dangerous “climate change/global warming”. Yet, despite the contradictions between what people are being told and what people have seen and can see about the weather and about the climate, they continue to be effectively steered away from the knowledge of such contradictions to focus on the claimed disaster effects of “climate change/global warming” (AGW, “Anthropogenic Global Warming”).
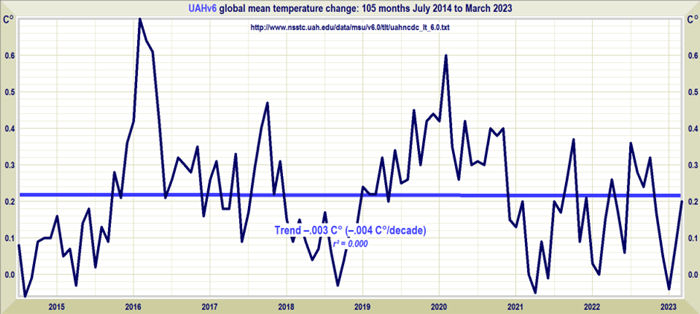
People are seldom told HOW MUCH is the increase of temperatures or that there has been no increase in globally averaged temperature for over 18 years. They are seldom told how miniscule is that increase compared to swings in daily temperatures. They are seldom told about the dangerous effects of government policies on their supply of “base load” energy — the uninterrupted energy that citizens depend on 24/7 — or about the consequences of forced curtailment of industry-wide energy production with its hindrance of production of their and their family’s food, shelter, and clothing. People are, in essence, kept mostly ignorant about the OTHER SIDE of the AGW debate.
Major scientific organizations — once devoted to the consistent pursuit of understanding the natural world — have compromised their integrity and diverted membership dues in support of some administrators’ AGW agenda. Schools throughout the United States continue to engage in relentless AGW indoctrination of students, from kindergarten through university. Governments worldwide have been appropriating vast sums for “scientific” research, attempting to convince the populace that the use of fossil fuels must be severely curtailed to “save the planet.” Prominent businesses — in league with various politicians who pour ever more citizen earnings into schemes such as ethanol in gasoline, solar panels, and wind turbines — continue to tilt against imaginary threats of AGW. And even religious leaders and organizations have joined in to proclaim such threats. As a consequence, AGW propaganda is proving to be an extraordinary vehicle for the exponential expansion of government power over the lives of its citizens.
Reasoning is hindered by minds frequently in a state of alarm. The object of this website is an attempt to promote a reasoned approach; to let people know of issues pertaining to the other side of the AGW issue and the ways in which it conflicts with the widespread side of AGW alarm (AGWA, for short). In that way it is hoped that all members of society can make informed decisions.
Climate Change News
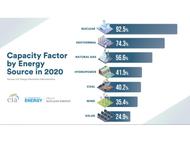
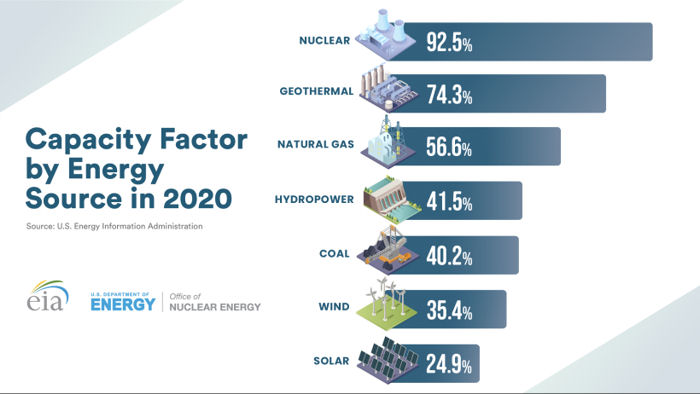
Capacity Factors - ORIGINAL CONTENT
- 5/2/23 at 07:00 AM
Energy Security is National Security - Highlighted Article
- 4/27/23 at 07:00 AM

Consensus & Science - ORIGINAL CONTENT
- 4/25/23 at 07:00 AM
The New Pause lengthens to 8 years 9 months - Highlighted Article
- 4/20/23 at 07:00 AM
Anomalous Anomalies - ORIGINAL CONTENT
- 4/18/23 at 07:00 AM
Dispatchable Wind & Solar - ORIGINAL CONTENT
- 4/11/23 at 07:00 AM
Life after Climate Change - Highlighted Article
- 4/6/23 at 07:00 AM

Not All-Electric - ORIGINAL CONTENT
- 4/4/23 at 07:00 AM
The Global Warming Doomsday Religion Is A Suicide Pact To Wreck Our Economy - Highlighted Article
- 3/30/23 at 07:00 AM

Not Zero - ORIGINAL CONTENT
- 3/28/23 at 07:00 AM
Feasibility for achieving a net zero economy for the U.S. by 2050 - Highlighted Article
- 3/23/23 at 07:00 AM

Lessons Learned? - ORIGINAL CONTENT
- 3/21/23 at 07:00 AM
Reliable vs. Intermittent Generation: A Primer (Parts I and II) - Highlighted Article
- 3/16/23 at 07:00 AM

Positive Weather News - ORIGINAL CONTENT
- 3/14/23 at 07:00 AM
Climate Uncertainty & Risk: the presentation - Highlighted Article
- 3/9/23 at 07:00 AM
-
Headlines
Search Headlines-
Louisiana’s Leadership on Breaking America’s Decades-Long Energy Stagnation
- Watts Up With That
- July 8, 2025
-
Climate Fact-Check June 2025
- Climate Realism
- July 8, 2025
-
The Spanish Version of the 'Duck Curve' is a real killer
- GreenNUKE - Substack
- July 8, 2025
-
Energy Innovation Policy & Technology on “Big, Beautiful Bill”
- Watts Up With That
- July 8, 2025
-
Sustainability Magazine’s Heat Wave Hype: Grid Struggles Stem from Policy, Not Climate
- Watts Up With That
- July 7, 2025
-
Trump’s Mineral Policy Offers Strategic Opportunity in the Pacific
- Watts Up With That
- July 7, 2025
-
Blackouts Coming If America Continues With Biden-Era Green Frenzy, Trump Admin Warns
- Daily Caller
- July 7, 2025
-
Solar Farms Paid To Switch Off
- Not A Lot Of People Know That
- July 6, 2025
-
DAVID BLACKMON: The OBBBA Resets The Energy Policy Playing Field
- Daily Caller
- July 5, 2025
-
Gas Crisis Looms Over California As Dems Continue To Impose Crippling Regs
- Daily Caller
- July 4, 2025
-
-
Scholars Wanted
 The Right Insight is looking for writers who are qualified in our content areas.
