
Climate Change
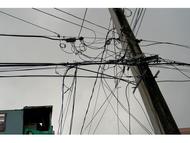
Two days before Halloween, 2011, New England was struck by a freak winter storm. Heavy snow descended onto trees covered with leaves. Overloaded branches fell on power lines. Blue flashes of light in the sky indicated exploding transformers. Electricity was out for days in some areas and for weeks in others. Damage to property and disruption of lives was widespread.
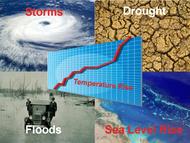
That disastrous restriction on human energy supplies was produced by Nature. However, current and future energy curtailments are being forced on the populace by Federal policies in the name of dangerous “climate change/global warming”. Yet, despite the contradictions between what people are being told and what people have seen and can see about the weather and about the climate, they continue to be effectively steered away from the knowledge of such contradictions to focus on the claimed disaster effects of “climate change/global warming” (AGW, “Anthropogenic Global Warming”).
People are seldom told HOW MUCH is the increase of temperatures or that there has been no increase in globally averaged temperature for over 18 years. They are seldom told how miniscule is that increase compared to swings in daily temperatures. They are seldom told about the dangerous effects of government policies on their supply of “base load” energy — the uninterrupted energy that citizens depend on 24/7 — or about the consequences of forced curtailment of industry-wide energy production with its hindrance of production of their and their family’s food, shelter, and clothing. People are, in essence, kept mostly ignorant about the OTHER SIDE of the AGW debate.
Major scientific organizations — once devoted to the consistent pursuit of understanding the natural world — have compromised their integrity and diverted membership dues in support of some administrators’ AGW agenda. Schools throughout the United States continue to engage in relentless AGW indoctrination of students, from kindergarten through university. Governments worldwide have been appropriating vast sums for “scientific” research, attempting to convince the populace that the use of fossil fuels must be severely curtailed to “save the planet.” Prominent businesses — in league with various politicians who pour ever more citizen earnings into schemes such as ethanol in gasoline, solar panels, and wind turbines — continue to tilt against imaginary threats of AGW. And even religious leaders and organizations have joined in to proclaim such threats. As a consequence, AGW propaganda is proving to be an extraordinary vehicle for the exponential expansion of government power over the lives of its citizens.
Reasoning is hindered by minds frequently in a state of alarm. The object of this website is an attempt to promote a reasoned approach; to let people know of issues pertaining to the other side of the AGW issue and the ways in which it conflicts with the widespread side of AGW alarm (AGWA, for short). In that way it is hoped that all members of society can make informed decisions.
Climate Change News
2021 Climate Prospective
- 1/5/21 at 03:00 AM

Highlighted Article: Welfare in the 21st century: Increasing development, reducing inequality, the impact of climate change, and the cost of climate policies
- 12/31/20 at 03:00 AM
2020 Retrospective
- 12/29/20 at 03:00 AM

Highlighted Article: The Unstoppable Momentum of Outdated Science
- 12/24/20 at 03:00 AM
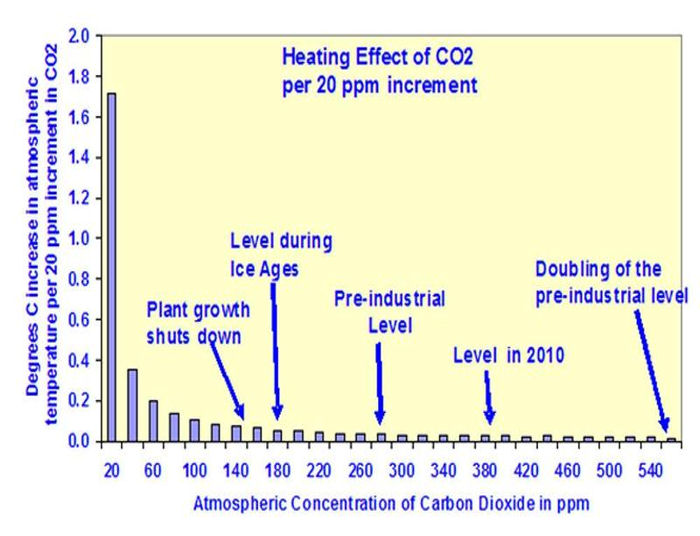
CO2 Saturation
- 12/22/20 at 03:00 AM
Highlighted Article: Cultural Motivations for Wind and Solar Renewables Deployment
- 12/17/20 at 03:00 AM

Evidence Communication
- 12/15/20 at 03:00 AM
"Anti-Science"
- 12/8/20 at 03:00 AM

Guest Post: Get Ready For Nationwide Blackouts Under Biden
- 12/7/20 at 03:00 AM
Highlighted Article: Preventing Future Forest Infernos
- 12/3/20 at 03:00 AM
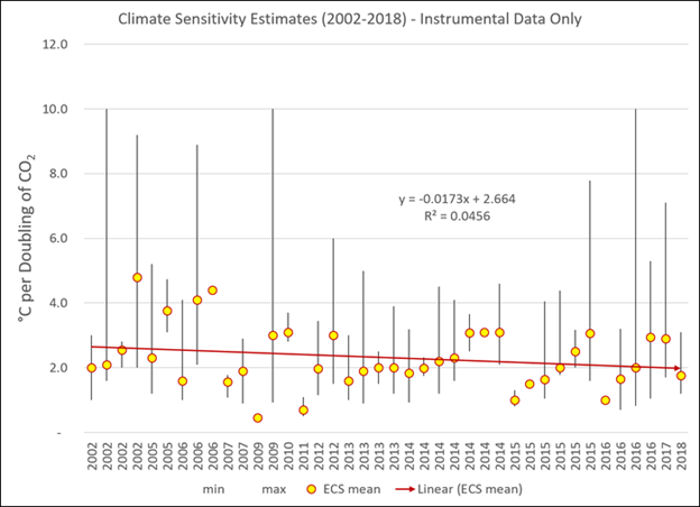
Climate (In)sensitivity
- 12/1/20 at 03:00 AM
Highlighted Article: The Contradictions of Green Policies to Limit CO2 Emissions
- 11/26/20 at 03:00 AM

Climate Anticipation
- 11/24/20 at 03:00 AM
Highlighted Article: Burning Stuff is so 16th Century
- 11/19/20 at 03:00 AM
“Science is Real”
- 11/17/20 at 03:00 AM
-
Headlines
Search Headlines-
The Human Climate Niche
- Irrational Fear - Substack
- July 24, 2024
-
Ford's EV Bloodbath Continues
- Substack
- July 24, 2024
-
How the failure of carbon capture risks causing a net zero nightmare
- Not A Lot Of People Know That
- July 24, 2024
-
Net zero will only make you poorer and China richer
- The Telegraph
- July 24, 2024
-
The Biden/Harris EPA data reveals U.S. heatwaves in the 1930s were significantly hotter than they are today
- Climate Depot
- July 23, 2024
-
Project 2025 on Energy (just a start, remember)
- Master Resource
- July 23, 2024
-
Our Investment in The Nuclear Company
- MCJ - Substack
- July 23, 2024
-
Solar Surplus: California's Renewable Energy Dilemma
- OilPrice.com
- July 22, 2024
-
Biden Admin Cuts Multi-Billion Dollar Check To Push ‘Community-Driven’ Green Projects All Over America
- Daily Caller
- July 22, 2024
-
Toyota’s Pratt Wisely Puts Automotive Eggs in Many Baskets
- Watts Up With That
- July 22, 2024
-
New York On Track To Miss Deadlines On Majority Of Its Lofty Climate Goals
- Daily Caller
- July 19, 2024
-
-
Scholars Wanted
 The Right Insight is looking for writers who are qualified in our content areas.
