Call or complete the form to contact us for details and to book directly with us
435-425-3414
435-691-4384
888-854-5871 (Toll-free USA)


Contact Owner

*Name
*Email
Phone
Comment
 
Skip to Primary Navigation Skip to Primary Content Skip to Footer Navigation
▽ Explore More ▽ Hide

Climate and Climate Change

Climate and Climate Change

Climate Change

Two days before Halloween, 2011, New England was struck by a freak winter storm. Heavy snow descended onto trees covered with leaves.  Overloaded branches fell on power lines.  Blue flashes of light in the sky indicated exploding transformers.  Electricity was out for days in some areas and for weeks in others. Damage to property and disruption of lives was widespread.

That disastrous restriction on human energy supplies was produced by Nature.  However, current and future energy curtailments are being forced on the populace by Federal policies in the name of dangerous “climate change/global warming”.  Yet, despite the contradictions between what people are being told and what people have seen and can see about the weather and about the climate, they continue to be effectively steered away from the knowledge of such contradictions to focus on the claimed disaster effects of  “climate change/global warming” (AGW, “Anthropogenic Global Warming”). 

People are seldom told HOW MUCH is the increase of temperatures or that there has been no increase in globally averaged temperature for over 18 years.  They are seldom told how miniscule is that increase compared to swings in daily temperatures. They are seldom told about the dangerous effects of government policies on their supply of “base load” energy — the uninterrupted energy that citizens depend on 24/7 — or about the consequences of forced curtailment of industry-wide energy production with its hindrance of production of their and their family’s food, shelter, and clothing. People are, in essence, kept mostly ignorant about the OTHER SIDE of the AGW debate.

Major scientific organizations — once devoted to the consistent pursuit of understanding the natural world — have compromised their integrity and diverted membership dues in support of some administrators’ AGW agenda.   Schools throughout the United States continue to engage in relentless AGW indoctrination of  students, from kindergarten through university.  Governments worldwide have been appropriating vast sums for “scientific” research, attempting to convince the populace that the use of fossil fuels must be severely curtailed to “save the planet.”  Prominent businesses — in league with various politicians who pour ever more citizen earnings into schemes such as ethanol in gasoline, solar panels, and wind turbines — continue to tilt against imaginary threats of AGW.  And even religious leaders and organizations have joined in to proclaim such threats.   As a consequence, AGW propaganda is proving to be an extraordinary vehicle for the exponential expansion of government power over the lives of its citizens. 

Reasoning is hindered by minds frequently in a state of alarm.  The object of this website is an attempt to promote a reasoned approach; to let people know of issues pertaining to the other side of the AGW issue and the ways in which it conflicts with the widespread side of AGW alarm (AGWA, for short).  In that way it is hoped that all members of society can make informed decisions.

Climate Change Humpty Dumptyism

“When I use a word, it means just what I choose it to mean—neither more nor less.”, Humpty Dumpty

Humpty Dumptyism: The practice of insisting that a word means whatever one wishes it to.

Fact: Something that has actual existence; an actual occurrence

Data: Factual information (such as measurements or statistics) used as a basis for reasoning, discussion, or calculation

I have previously written about facts in relation to global temperature measurements. Climate scientists recognize that not all of the data they collect are necessarily “facts”, because they have been collected at the wrong time, or are of questionable accuracy for other reasons. However, they are still data, in that they are measurements, even if they are known or suspected to be inaccurate, subject to the conditions surrounding their acquisition.

All of the data collected from measuring stations on a given day, or during a given month, constitute a dataset for that period. However, those datasets might not be complete, if data is not collected from all measurement sites for some reason. When a producer of temperature anomaly products selects data for analysis from a dataset, eliminating missing data, obvious data “outliers”, etc. they create a subset of the data which becomes their dataset for that period.

It is common practice among the producers of temperature anomaly products to “adjust” the data in their data sets to compensate for errors and suspected biases. In making these ‘adjustments”, their datasets become “estimate sets”, since the temperatures in the sets are no longer actual measurements. Rather, they are now estimates of what the data might have been if it had been collected timely from properly sited, calibrated, installed and maintained instruments. However, it is also common practice to continue to refer to these sets of temperatures as datasets.

NASA GISS typically “infills” their estimate sets with estimates of the likely temperatures in areas in which there are no measuring stations, or from which no data were collected for other reasons during the current period. It is typical to refer to the “infilled” estimate sets as datasets, despite the fact that most of the original data has been “adjusted” and missing data has been “infilled” with manufactured estimates.

The producers of the temperature anomaly products then compute a global average temperature value from their estimate sets for the period under analysis. This temperature value is then compared with the average estimated temperature value for the corresponding period (month or year) during a thirty-year reference period. The calculated temperature difference between the current period and the reference period is then recorded as the temperature anomaly estimate for the current period.

The “adjustments” made to the data prior to calculation of the anomaly for the period are the only “adjustments” made to the data. However, it is not uncommon for further adjustments to be made to the estimate sets over time, as discussed here and here. Again, it is certainly possible the estimate sets are accurate; and, that the subsequent anomaly calculations are also accurate at some point in the ongoing “adjustment” process. However, if that is the case, it would be very difficult to determine which of the “adjusted” values is accurate.


Tags: Adjusted Data, Estimates as Facts, Global Temperature, Temperature Record

Highlighted Article: Intimidating the “Deniers” to Enforce the “Consensus”

  • 3/8/18 at 09:29 AM

By: Marc Morano

This is a bonus chapter that was not included in Marc Morano's book - The Politically Incorrect Guide to Climate Change.

Intimidating the “Deniers” to Enforce the “Consensus”


Tags: Highlighted Article

Temperature “Adjustments” ad Infinitum

The temperature measurements taken to produce the global near-surface temperature anomaly record are “adjusted” for a variety of reasons.  However, the measurements are not “adjusted” once, to achieve a hopefully more accurate value. The graph below, produced by climate4you.com, illustrates the “adjustment” history of calculated temperature anomaly for two specific months in the past, over a period of 10 years, from 2008 to present.

NCDC temperature adjustments

The National Climatic Data Center (NCDC) temperature anomaly value for the month of January 2000 was “adjusted” more than 40 times over the 10-year period from May 2008 to January 2018. While there were both positive and negative “adjustments” made to the calculated temperature anomaly, the net result was an increase of 0.07oC, or more than a 25% increase from the earliest anomaly value shown in the graph.

The NCDC temperature anomaly value for January 1915 was also “adjusted” more than 40 times over the 10-year period from May 2008 to January 2018. Again, there were both positive and negative “adjustments” made to the calculated anomaly. However, in this case, the net result was a decrease of 0.005oC, or only a 4% reduction from the earliest anomaly value shown. It is interesting to note that the calculated anomaly was reduced by as much as 0.065oC during the period, before being increased again in June 2015.

There is no obvious explanation for the apparent need to retrospectively “re-adjust” the temperature anomaly calculations this frequently, or to this extent. The “adjustments” are all in the second decimal place, which means that they are all made at a greater level of “precision” than the underlying measurements.

The graph below illustrates similar retrospective temperature anomaly adjustments made by NASA GISS.

In the January 2000 case, while there are both positive and negative “adjustments”, the net result is again a positive adjustment of 0.07oC. However, in this case, that “adjustment” represents an increase of approximately 40% from the earliest anomaly value shown in the graph. It is important to note that NCDC “adjusts” the temperature measurements before providing them to NASA GISS, which then “re-adjusts” them. The GISS “re-adjustment”, in this case, results in a first anomaly value 0.10oC lower than the anomaly value provided to GISS by NCDC; and, thus, a lower final anomaly value as well.

In the January 1910 case, again there are both positive and negative “adjustments”, but the net result is a negative “adjustment” of 0.17oC. Note that both the January 2000 and the January 1910 values are “re-adjusted” less frequently by NASA GISS than by NCDC.

Both in the case of NCDC and NASA GISS, the net effect of these “re-adjustments” is to increase the temperature anomaly change from the earlier month in 1915 or 1910 to the anomaly in January 2000. In the case of NCDC, the anomaly increase is 0.08oC.  In the case of GISS, the anomaly increase is 0.24oC, or three times the anomaly increase calculated by NCDC. It is also important to note that these changes only reflect the period from 2008 to 2018. There is no corresponding record of “adjustments” made prior to 2008 available from climate4you.com. However, there is little reason to believe that the “adjustments” shown in the graph above were the first “adjustments” made to these anomalies, or that they will be the last.

It is possible that one of the anomaly values shown in each graph line is accurate, but it is certainly not possible that all of the values are accurate; and, it is not certain that any of the values are accurate.


Tags: Temperature Record, Global Temperature, National Climatic Data Center (NCDC), NASA

Highlighted Article: Circular Reasoning In Climate Change Research

  • 3/1/18 at 06:05 AM

By: Jamal Munshi


 Circular Reasoning In Climate Change Research


ABSTRACT: A literature review shows that the circular reasoning fallacy is common in climate change research. It is facilitated by confirmation bias and by activism such that the prior conviction of researchers is subsumed into the methodology. Example research papers on the impact of fossil fuel emissions on tropical cyclones, on sea level rise, and on the carbon cycle demonstrate that the conclusions drawn by researchers about their anthropogenic cause derive from circular reasoning. The validity of the anthropogenic nature of global warming and climate change and that of the effectiveness of proposed measures for climate action may therefore be questioned solely on this basis.

Circular Reasoning In Climate Change Research


Tags: Highlighted Article

Optimum Climate

The instrumental temperature record began with the Central England Temperature (CET) record in the mid-1600s. This period roughly coincides with the nadir of the Little Ice Age (LIA), which extended from approximately 1350 to approximately 1850. The broader instrumental temperature record began in the mid-1800s, roughly corresponding with the end of the LIA. Prior to the instrumental temperature records, all global temperature estimates are based on the analysis of temperature proxies, including tree rings, ice cores, sediments, etc.

The determination of what is the “normal” global average near-surface is frequently tied to the estimated temperature at the end of the LIA (~1850), which is also considered to be the end of the pre-industrial period. This global average near-surface temperature is estimated to be ~57oF (~14oC). This compares to an estimated global average near-surface temperature of ~54oF (~12oC) at the nadir of the LIA. This also compares to a current estimated global average near-surface temperature of ~58.6oF (~15oC), which is similar to the estimated global average near-surface temperature at the peak of the Medieval Warm Period.

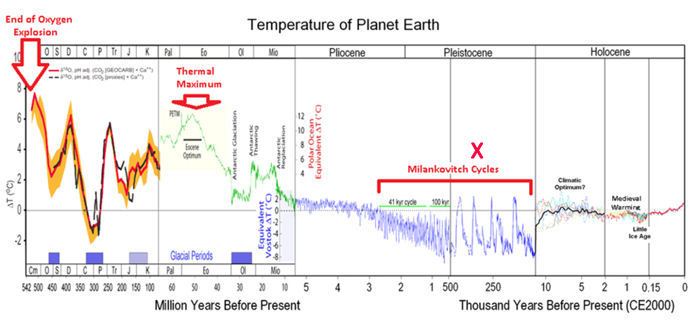
The global average near-surface temperature has apparently fluctuated between ~54oF (~12oC) and ~59oF (~15oC) over the past 4500 years. Humanity has found this temperature range congenial, though the warmer periods have been more congenial than the cooler periods, such as the LIA. All of the temperature fluctuations in the first ~4350 years of this period are generally considered to have been the result of natural variation. However, the net positive temperature change over the most recent ~150 years, and especially over the past ~70 years, are frequently attributed, in whole or in part, to human influences, primarily the addition of greenhouse gases to the atmosphere.

It should be noted that the net positive temperature change over the recent ~150-year period has been punctuated by frequent warming and cooling events resulting from continued natural variation. These warming and cooling events have been triggered by El Nino and La Nina events, the Pacific Decadal Oscillation and Atlantic Multi-Decadal Oscillation, as well as by volcanic activity and other non-anthropogenic influences.

UAH Satellite-Based Temperature of the Global Lower Atmosphere

The most dramatic of these natural warming and cooling events was the warming and subsequent cooling associated with the 1997 /1998 El Nino, which produced a temperature spike ~80% of the magnitude of the temperature change since 1850. However, there are numerous other significant natural variations, ranging from ~30% - ~50% of the temperature change since 1850. It is not currently possible to isolate the natural components of these temperature changes from the anthropogenic components.

It should also be noted that the global average near-surface temperature is calculated from a large number of widely varying local and regional near-surface temperatures. For example, the annual average near-surface temperature in Barrow, Alaska is ~17oF, approximately 40oF below the global average; and, in Fairbanks, Alaska the average near-surface temperature is ~37oF, approximately 20oF below the global average. Also, the annual near-surface temperature in Phoenix, Arizona is ~75oF, or approximately 18oF above the global average near-surface temperature.

One issue which is rarely, if ever, raised is the issue of “ideal”, or “optimum” conditions (temperature, precipitation, etc.). Many probably assume that the long-term average global near-surface temperature of ~57oF is the “ideal” temperature, which we should make every effort to maintain. But that raises questions regarding the historical average near-surface temperatures in widely varying locations, such as those noted above. Clearly, if the global average near-surface temperature is “ideal”, then the average temperatures in Fairbanks and Phoenix are non-ideal, as are the temperatures in most of the rest of the globe.


Tags: Global Temperature, Temperature Record, Natural Variability

Climate and the First Amendment

Congress shall make no law respecting an establishment of religion, or prohibiting the free exercise thereof; or abridging the freedom of speech, or of the press; or the right of the people peaceably to assemble, and to petition the Government for a redress of grievances.

The Framers apparently had little concept of the power the Executive Branch and its agencies would develop over time; or, the influence that international bodies would have on the conduct of affairs in the United States. The First Amendment prohibits Congress from making laws, but does not expressly prohibit the Executive Branch from making rules which have essentially the same effect.

The United Nations has effectively established climate change as a form of secular religion globally. Interestingly, this secular religion has been accepted by the leaders of numerous established religions, who support adherence to its beliefs.

The Executive Branch of the US government has essentially established climate change as a form of secular religion in the US. This religion has a system of beliefs which are expected to be accepted without question. These beliefs include: the existence and pre-eminence of anthropogenic climate change; the causes of anthropogenic climate change; the modeled scenarios of potential future climate change; and, the actions required to avoid or mitigate impending climate catastrophe.

Those who question this system of secular religious beliefs are called deniers and treated as heretics. Certain members of Congress, though not the Congress as a body, have attempted to intimidate and silence non-believers, questioning their freedom to speak out in opposition to the climate orthodoxy. Scientists have been removed from positions in the federal government and state governments because they questioned the climate orthodoxy. Other scientists have left the climate change field as the result of harassment.

The current US President is skeptical of the beliefs of this secular religion, as is the current Administrator of US EPA. They are acting to dismantle some of the administrative rules established in support of the climate change religion in the US; and, to reduce or eliminate government funding in support of the climate change religion, including funding to the UN. Their actions are also encouraging skeptics to speak more freely regarding their issues with the climate orthodoxy.

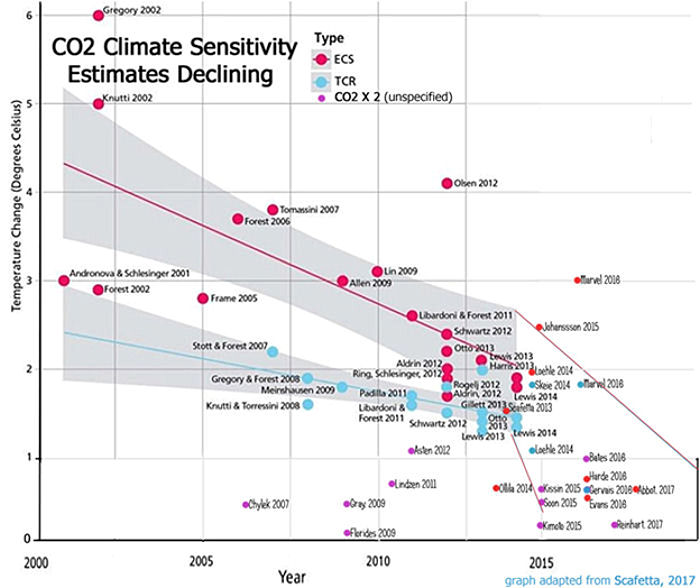
Belief in the modeled scenarios of potential future climate change is currently being called into question on two fronts. First, the modelers have been forced to acknowledge that the models are showing far more rapid warming than is actually occurring, even compared to the “adjusted” temperature anomalies. Also, numerous recent studies have suggested climate sensitivities lower than the sensitivity range used by the climate models.

While the recent science suggests that there might not be an impending climate catastrophe, numerous spokespersons for the UN Framework Convention on Climate Change have recently concluded that the emissions reductions committed to in the Paris Accords are insufficient to achieve the objective of keeping the global temperature anomaly increase below 2oC.

Again, it appears that the “settled science” on which the climate change religion is based might not be as settled as we have been asked to believe.


Tags: Climate Religion, Climate Change Debate

Highlighted Video: Can Climate Models Predict Climate Change?

  • 2/15/18 at 08:25 AM

By: Emeritus Professor of Physics at Princeton University Will Happer

"I’m a physicist.  I taught at Columbia University and then at Princeton for five decades.

I have published over 200 peer-reviewed scientific papers. I have coauthored several books, including one of the first on how carbon dioxide emissions—CO2—affects the climate."

"Predicting climate temperatures isn't science – it's science fiction."


Tags: Highlighted Article

Climate Change Myth - The Crusade to Restore Camelot

The title of this commentary is the subtitle of the paper “Climate and Climate Change” on this site. The lyrics of the song “Camelot”, from the Broadway show of the same name, composed by Alan Jay Lerner and Frederick Loewe, are reproduced below.

ARTHUR:

It's true! It's true! The crown has made it clear.

The climate must be perfect all the year.

A law was made a distant moon ago here:

July and August cannot be too hot.

And there's a legal limit to the snow here

In Camelot.

The winter is forbidden till December

And exits March the second on the dot.

By order, summer lingers through September

In Camelot.

Camelot! Camelot!

I know it sounds a bit bizarre,

But in Camelot, Camelot

That's how conditions are.

The rain may never fall till after sundown.

By eight, the morning fog must disappear.

In short, there's simply not

A more congenial spot

For happily-ever-aftering than here

In Camelot.

Camelot! Camelot!

I know it gives a person pause,

But in Camelot, Camelot

Those are the legal laws.

The snow may never slush upon the hillside.

By nine p.m. the moonlight must appear.

In short, there's simply not

A more congenial spot

For happily-ever-aftering than here

In Camelot.


This song, first performed on Broadway in 1960, could well be the theme song of today’s climate change activists, who wish for and work for a return to some idealized past climate which they found to be, or believed to have been, comfortable and congenial. From their perspective, there should continue to be seasons, but they should occur on a consistent schedule; and, they should not include any extreme weather. There should be no early or late frosts and freezes. There should still be rain and snow, but there should not be too much or too little of either, especially at any given time.

Climate change activists have warned about the end of snow; and, of the end of sea ice and glaciers. They have warned about increasing droughts and floods, increasing and strengthening storms. They have continued these warnings in the face of decreasing storm frequency and intensity. They largely ignored the 12-year hiatus in major hurricane landfalls in the US, but immediately attributed the perceived increased intensity of recent storms to climate change, regardless of the absence of any data to support their contentions.

Certainly, the idealized Camelot never experienced “Snowmageddon”, “Bomb Cyclones”, “Super Storms”, “Polar Vortices”, “Biblical Floods”, “Mega-droughts”, or any of the other newly named events, all of which have occurred previously, without the benefit of their fancy (scary) new names. Climate change activists have extended the naming of storms, such as hurricanes, to snow storms and other events to further call attention to them, even though those events are not unique or even unusual.

There is no equivalent to the mythical Camelot in the real world. Most of the population of the earth lives in climates which bear no significant resemblance to Camelot; and, never have or ever will. Each of these climates has its unique characteristics, though these characteristics are not immutable. Climate change produces variations in the historical characteristics of the weather in these individual climates, but does not introduce new characteristics with no historical precedents.

Much of the adverse impact of severe weather events in any of these climates is the result of human decisions to risk exposure to weather events such as hurricanes and typhoons, tornadoes, monsoons, floods, blizzards, high winds, extreme cold and heat, etc. Other adverse impacts of non-weather events are the result of human decisions to risk exposure to earthquakes, volcanos, tsunamis, etc.

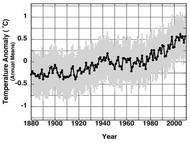
There is no data to support the assertion that any of these weather-related events have been affected, either positively or negatively, by the climate change which has been documented over the period since 1880 for which we have weather and climate data.


Tags: Climate Change Myths

Highlighted Article: Validity of Global Average Surface Temperature Data and CO2 Endangerment Finding

  • 2/8/18 at 06:27 AM
  • Dr. James P. Wallace III
  • Dr. Joseph S. D’Aleo
  • Dr. Craig D. Idso

June 2017

"The conclusive findings of this research are that the three GAST data sets are not a valid representation of reality. In fact, the magnitude of their historical data adjustments, that removed their cyclical temperature patterns, are totally inconsistent with published and credible U.S. and other temperature data. Thus, it is impossible to conclude from the three published GAST data sets that recent years have been the warmest ever –despite current claims of record setting warming. Finally, since GAST data set validity is a necessary condition for EPA’s GHG/CO2 Endangerment Finding, it too is invalidated by these research findings."

On the Validity of NOAA, NASA and Hadley CRU Global Average Surface Temperature Data & The Validity of EPA’s CO2 Endangerment Finding Abridged Research Report


Tags: Highlighted Article

Climate Change Goes to Court

Several lawsuits filed by California cities and counties and a similar lawsuit filed by New York City against major oil companies seek billions for current and potential future damages resulting from climate change caused by CO2 emissions from their products. Another lawsuit, filed by a group of children against the US federal government, claims that “government's actions and failures to act have caused climate change, thus violating the youngest generation's constitutional rights to life, liberty and property, and have failed to protect essential public trust resources.”

The California and NYC lawsuits focus primarily on sea level rise caused by climate change. However, sea level has been rising, at a relatively constant rate, since before human emissions of CO2 are believed to have begun having an impact on climate. While changes in sea level are measurable, there is no scientific method to measure any incremental contribution of increased atmospheric CO2 concentrations to natural sea level rise in the period following the trough of the Little Ice Age. Therefore, there is no scientific basis on which to allocate some percentage of current and possible future adverse impacts of continued sea level rise to anthropogenic climate change.

The children’s lawsuit against the government is broader in scope, but probably less defensible scientifically. There is no documented evidence of loss of life or liberty in the US attributable to climate change. Sea level rise arguably results in a loss of property, but there is no scientific basis on which to attribute that loss of property to climate change resulting from government action or inaction.

There have been broad accusations in the media that climate change made the impacts of tropical storm Sandy and hurricanes Harvey, Irma and Maria greater than they would otherwise have been. However, none of these accusations are based on measured data. These storms, while unusual, were not unprecedented. The storms were not as unusual as the twelve-year hiatus in major hurricane landfalls which preceded them. Recent analysis of global weather-related damages by Dr. Roger Pielke, Jr. demonstrates that global damages have declined as a percentage of global GDP since 1990, despite peaks in 2005 and 2017.

Proving responsibility for some fraction of current damages on anthropogenic climate change will be difficult, since it is not currently possible to measure any incremental impact. However, proving responsibility for potential future damages will be even more difficult, as well assigning some potential future costs to those damages.

Scenarios describing potential future climate change resulting from increased anthropogenic CO2 emissions are based on unverified climate models, which can hardly be considered to constitute evidence. The potential future financial impacts of those modeled scenarios are based on unverified assumptions applied to those scenarios produced by the unverified climate models, which can hardly be considered to constitute evidence.

We can expect some interesting discussions regarding the rules of evidence as these lawsuits proceed. These discussions will likely include whether “adjustment” of measured temperatures and measured sea level rise represents evidence tampering; and, whether “infilling” temperatures where no data exists represents manufacturing evidence.


Tags: Climate Change Lawsuits

Revisionist Climate History

The graphs below were prepared and published by NASA in October, 2005 and in January and October, 2015. The graphs were highlighted and annotated by Professor Howard Cork Hayden to call attention to changes made to the historical near-surface temperature anomaly record. All three graphs are based on the same historical data for the period 1880 – 2005. The two 2015 graphs contain additional temperature anomaly results based on additional data for the period 2005 – 2015.

Nasa October 2005 Global Temperature

The 2005 near-surface temperature anomaly value is the same in each of the three graphs, as indicated by the red circles at the upper bounds of the highlighted areas. However, the 1880 near-surface temperature anomaly values are not the same in the three graphs, as indicated by the red circles at the lower bounds of the highlighted areas.

The 1880 near-surface temperature anomaly value is -0.12ºC in the October 2005 graph above. However, the 1880 near-surface temperature anomaly value is reduced to -0.4ºC in the January 2015 graph below; and, reduced again to -0.5ºC in the October 2015 graph. These reductions, a factor of +4ºC in total, increase the reported temperature anomaly increase over the 1880 – 2005 period by 0.5ºC, or ~70%.

NASA January 2015 Global Temperature

It should be obvious that NASA collected no new data from the 1880 – 1940 period over which the changes in the anomaly values were made. Rather, the temperature data which had been “adjusted” prior to computing the anomalies shown in the 2005 graph, were “readjusted” prior to the publication of the January 2015 graph and again prior to the publication of the October 2015 graph.

NASA October 2015 Global Temperature

Data are immutable. However, NASA “adjusted” temperature anomalies appear to be both highly and multiply mutable. The changes shown in the three graphs reproduced above clearly demonstrate that the three different values for the 1880 anomaly cannot all be accurate; and, raise the question of whether any of the values are accurate. In fact, virtually all of the annual anomaly values for the period 1880 – 1940 have been “readjusted” since the graph was published in October 2005.

It is also important to recall that the temperature data used to calculate the anomalies shown in the graphs above had been “adjusted” by NOAA before being submitted to NASA GISS (Goddard Institute for Space Studies), which then further “adjusted” the anomalies before producing the graphs. While the adjustments to the historical data do not affect the value of the current anomaly, they do affect the magnitude of the total anomaly since 1880; and, they affect the rate of change of the anomalies over the period since 1880.

Changes to the calculated historical anomalies, such as those illustrated in the three graphs above, raise significant questions about the accuracy and the value of the near-surface temperature anomaly records. Assignment of a Tiger Team to review the accuracy of the near-surface temperature anomaly products produced by NOAA and NASA and the justification for the multiple “adjustments” and “readjustments” to the temperature data and temperature anomaly products should be a precursor to any Red Team / Blue Team debate which allowed those records to be used as evidence.


Tags: Global Temperature, NASA, Global Historical Climate Network (GHCN)

Climate Change Commune-ification

The ultimate goal of those promoting the catastrophic anthropogenic global warming meme is the establishment of a global vegan commune of approximately 1 billion souls, run by some subset of the tinpot despots represented in the United Nations General Assembly.

Achieving this goal would require global governance, enforced veganism, enforced communal living and dramatic population control programs. Achieving this goal by the end of the 21st century would arguably require enforced eugenics and genocide. This would seem possible only to those who believe that the end justifies the means; and, those willing to choose who lives and who dies, or who is born and who is not born. However, there appear to be sufficient numbers of such people available.

The commune must be global, to assure that the entire global population is included, as are all global wealth and resources. There can be no alternative which would permit the wealthy, the productive and the ambitious to thrive separately and avoid sharing life with the poor, the unproductive and the unmotivated.

The commune must be vegan, to avoid the “greenhouse gas” emissions resulting from animal husbandry, as well as the requirement for massive land allocations to grazing or food production to support large populations of meat and dairy animals. These land areas would be reforested, where possible, to assist in removing CO2 from the atmosphere to avoid an impending climate catastrophe, or converted to crop production for human consumption.

The population of the global commune must be stabilized and then reduced to relieve stress on global resources and food production.

"The power of population is so superior to the power of the Earth to produce subsistence for man, that premature death must in some shape or other visit the human race.", Thomas Robert Malthus

Malthusianism is still promoted by Paul and Ann Ehrlich and by former presidential science advisor John Holdren, among others.

The UN bureaucracy is actively planning for global governance, though it is still focused on achieving this through the cooperation of sovereign governments, rather than by replacing sovereign governments with a single, global government.

There is no history of global governance of a communal society, though there is a history of national governments of large involuntary communal societies. That history is not a history of great success, but rather a history of repression and deprivation, as well as a history of mass population reductions in which more than 100 million people died. However, even that is a “drop in the bucket” compared to the population reductions required to satisfy the Malthusians.

Despite the sad history of religious suppression in communal societies, numerous religious leaders appear surprisingly anxious to support the efforts of national politicians and UN bureaucrats to move the world toward the ultimate goal of a global commune.

Interestingly, the largest of the involuntary communal societies have abandoned or substantially modified their communal structures. There are reportedly only five remaining communist nations (including China), four of which require substantial outside assistance to survive. The ultimate problem with a global communal society is that there would be no “outside” to provide assistance.

“The problem with socialism is that eventually you run out of other peoples’ money.”, Lady Thatcher

Socialism is the Big Lie of the twentieth century. While it promised prosperity, equality, and security, it delivered poverty, misery, and tyranny. Equality was achieved only in the sense that everyone was equal in his or her misery.”, Mark Perry

“Communism might help men cope with poverty, but it can never get them out of it. At best, communist societies stay stagnant.”, Will Durant


Tags: Global Governance, Population Control

Highlighted Article - My Global Warming Skepticism, for Dummies

  • 1/18/18 at 10:20 AM

By: Roy Spencer PH. D.

“The total amount of CO2 humans have added to the atmosphere in the last 100 years has upset the radiative energy budget of the Earth by only 1%. How the climate system responds to that small ‘poke’ is very uncertain. The IPCC says there will be strong warming, with cloud changes making the warming worse. I claim there will be weak warming, with cloud changes acting to reduce the influence of that 1% change."

My Global Warming Skepticism, for Dummies


Tags: Highlighted Article

Climate Science Peer Review Is A Zombie

Climate science peer review is the “walking dead”, kept walking by those who “killed” it in the first place. It was “killed” by those it was intended to serve, by their willingness to provide “pal” review to those with whom they agreed and their unwillingness to provide fair (or any) review to researchers with whom they disagreed. This process has resulted in the publication of “peer” reviewed studies in major journals which have later been demonstrated to be flawed. It has arguably also resulted in skeptical studies not being published, or being published in lesser known scientific journals.

There appear to have been numerous factors which contributed to the zombification of climate science peer review, including:

  • willingness of journals to permit authors to select their peer reviewers;
  • unwillingness of authors to select critical peers;
  • willingness of journals to publish studies without providing access to all the background materials necessary for critical review;
  • reluctance of authors to provide access to their work product by peers expected to be critical of their work; and,
  • failure of authors to properly archive their work product.

Many of these factors only became apparent as the result of the publication of the Climategate e-mails, which exposed the active resistance of researchers at the University of East Anglia to providing data to skeptical peers, efforts to avoid publication of skeptical research in premier journals and to prevent its inclusion in the reports of the IPCC and efforts to have journal editors disciplined or fired for allowing peer review of skeptical research and its subsequent publication.

The Climategate e-mails also exposed the existence of “Mike’s Nature trick”, which Michael Mann used to help shape his “hockey stick”; and, the broad awareness of Mann’s “trick” within the consensed climate science community. Dr. Mann has since aggressively resisted FOIA requests for release of his e-mail exchanges with other climate researchers and the supporting data and analytical procedures involved in creation of the “hockey stick”. Mann has also sued another climate researcher, several authors and an internet website for criticizing the “hockey stick”. Interestingly, he and his attorneys have “slow walked” the legal process, avoiding discovery while increasing the legal expenses of those he has sued. The source(s) of his funding for these legal efforts are unknown.

Dr. Susan Crockford, a Canadian zoologist recently published a paper which contradicted the conclusions of polar bear research published previously. She was quickly attacked in an online piece by the authors of the earlier research and others.  She has demanded a retraction.

Dr. Mark Jacobson and several co-authors published a study regarding renewable energy, which was later challenged in a paper by another group of authors. Jacobson has since sued the authors of the paper challenging his work for defamation. The source(s) of his funding for the lawsuit are unknown.

At the extreme, funding of skeptical climate research can be and has been limited or prevented by “peers” unwilling to provide fair peer review of skeptics’ research proposals. Roger Pielke, Jr. says he has been told by a National Science Foundation (NSF) officer: “Don’t even bother submitting an NSF proposal, because we won’t be able to find a reviewer who will give you a positive score.”


Tags: Peer Review

Defending Climate Orthodoxy

scientific method: principles and procedures for the systematic pursuit of knowledge involving the recognition and formulation of a problem, the collection of data through observation and experiment, and the formulation and testing of hypotheses. 

One of the most egregious aspects of the activities exposed by the Climategate e-mails was the concerted effort to deter publication of scientific papers which questioned the climate orthodoxy of the consensed climate science community and prevent inclusion of those papers in the IPCC reports. Despite their discovery as the result of Climategate, these activities have continued unabated. While the consensed climate science community has been unsuccessful in preventing publication of scientific papers critical of the climate orthodoxy, it has been successful in keeping most of them from publication in the premier scientific journals in the US and Europe; and, it has been successful in suppressing media attention to the studies.

There were more than 500 scientific papers supportive of some aspect of climate skepticism published in 2016. More than 400 such papers have been published in 2017. (Interestingly, a search for this article produced a SNOPES “Fact Check” as the first result.) These papers have received little or no attention in the US media, largely as the result of their publication in secondary journals; and, as the result of the absence of promotion by the consensed climate science community.

The attention of the US media is primarily focused on the results of government funded studies involving the use of unverified climate models to create scare scenarios. The study authors, the journals in which they publish and the government agencies which fund their studies are conscientious in their efforts to attract media attention; and, the “if it bleeds, it leads” media are all too anxious to cooperate.

The ability of members of the consensed climate science community to suggest potential peers to participate in peer review of their scientific studies, generally to the exclusion of skeptical reviewers, has reportedly degenerated into a system of “pal review”. This has been accompanied by an unwillingness on the part of members of the consensed climate science community to review scientific papers by skeptics of the climate orthodoxy; and, by submission of persistent critical reviews of skeptical papers.

One of the most active areas of skeptical climate research is the study of the sensitivity of the climate to increasing atmospheric CO2 concentrations, which the consensed climate science community has identified as the “control knob” of global climate. Numerous skeptical climate scientists question this view of CO2, referring to it as a “fallacy”. Several recent studies have suggested climate sensitivities to CO2 significantly lower than the range of values used by the IPCC.

The continued divergence of the Climate Model Intercomparison Project Phase 5 (CMIP5) climate model scenarios from the observed global temperatures have caused members of the consensed climate science community to acknowledge that there are problems with the climate models, including excessive sensitivities ascribed to the “control knob”.

In summary, the “settled science” might not be “settled” after all; and, the climate orthodoxy might not be as orthodox as we have been asked to believe.


Tags: Climate Science, Climate Skeptics, Peer Review
Search Older Blog Posts