Call or complete the form to contact us for details and to book directly with us
435-425-3414
435-691-4384
888-854-5871 (Toll-free USA)


Contact Owner

*Name
*Email
Phone
Comment
 
Skip to Primary Navigation Skip to Primary Content Skip to Footer Navigation
▽ Explore More ▽ Hide

Climate and Climate Change

Climate and Climate Change

Climate Change

Two days before Halloween, 2011, New England was struck by a freak winter storm. Heavy snow descended onto trees covered with leaves.  Overloaded branches fell on power lines.  Blue flashes of light in the sky indicated exploding transformers.  Electricity was out for days in some areas and for weeks in others. Damage to property and disruption of lives was widespread.

That disastrous restriction on human energy supplies was produced by Nature.  However, current and future energy curtailments are being forced on the populace by Federal policies in the name of dangerous “climate change/global warming”.  Yet, despite the contradictions between what people are being told and what people have seen and can see about the weather and about the climate, they continue to be effectively steered away from the knowledge of such contradictions to focus on the claimed disaster effects of  “climate change/global warming” (AGW, “Anthropogenic Global Warming”). 

People are seldom told HOW MUCH is the increase of temperatures or that there has been no increase in globally averaged temperature for over 18 years.  They are seldom told how miniscule is that increase compared to swings in daily temperatures. They are seldom told about the dangerous effects of government policies on their supply of “base load” energy — the uninterrupted energy that citizens depend on 24/7 — or about the consequences of forced curtailment of industry-wide energy production with its hindrance of production of their and their family’s food, shelter, and clothing. People are, in essence, kept mostly ignorant about the OTHER SIDE of the AGW debate.

Major scientific organizations — once devoted to the consistent pursuit of understanding the natural world — have compromised their integrity and diverted membership dues in support of some administrators’ AGW agenda.   Schools throughout the United States continue to engage in relentless AGW indoctrination of  students, from kindergarten through university.  Governments worldwide have been appropriating vast sums for “scientific” research, attempting to convince the populace that the use of fossil fuels must be severely curtailed to “save the planet.”  Prominent businesses — in league with various politicians who pour ever more citizen earnings into schemes such as ethanol in gasoline, solar panels, and wind turbines — continue to tilt against imaginary threats of AGW.  And even religious leaders and organizations have joined in to proclaim such threats.   As a consequence, AGW propaganda is proving to be an extraordinary vehicle for the exponential expansion of government power over the lives of its citizens. 

Reasoning is hindered by minds frequently in a state of alarm.  The object of this website is an attempt to promote a reasoned approach; to let people know of issues pertaining to the other side of the AGW issue and the ways in which it conflicts with the widespread side of AGW alarm (AGWA, for short).  In that way it is hoped that all members of society can make informed decisions.

Highlighted Article: Climate Change – Ebb and Flow of the Tide

  • 4/30/20 at 06:00 AM


From: Watts Up With That?

By: Dr. Kelvin Kemm

Date: March - April 2020


Climate Change – Ebb and Flow of the Tide

Part 1 - March 27, 2020
Part 2 - April 16, 2020
Part 3 - April 20, 2020


"Emotional, agenda-driven politics confronts sound, evidence-based science

Dr Kelvin Kemm

The topic of global warming and climate change is far more scientifically complex than the public is led to believe.

Myriads of newspaper, magazine and TV items over decades have tended to simplify the science to the point at which the general public believes that it is all so simple that any fool can see what is happening. Public groups often accuse world leaders and scientists of being fools, if they do not instantly act on simple messages projected by individuals or public groups.

One often hears phrases like: ‘The science is settled.’ It is not. Even more worrying is that the reality of the correct science is actually very different to much of the simple public perception.

An additional complicating factor is that there are political groupings wanting to change the world social order and who are using the climate change issue as a vehicle to achieve these objectives. They want the ‘science’ to say what they want it to say and are not interested in the truth. Sections of the public, with noble good intentions, then frequently do not realise that they are being induced by such elements to unwittingly support a political agenda, which in reality is unrelated to the climate issue." ...


Climate Change – Ebb and Flow of the Tide

Part 1 - March 27, 2020
Part 2 - April 16, 2020
Part 3 - April 20, 2020


Tags: Highlighted Article

Signal / Noise Ratio (Climate Change)


“Signal-to-noise ratio (abbreviated SNR or S/N) is a measure used in science and engineering that compares the level of a desired signal to the level of background noise.”, everything.explained.today


Previous commentaries (here, here, and here) have dealt with the signal to “noise” ratio of the primary climate change signals: temperature, sea level and extreme weather. The temperature signal has a significant natural noise component as well as a significant noise component resulting from “adjustment” of the temperature data. The sea level signal has a significant noise component, primarily because the surface of the global oceans is constantly disturbed by the effects of wind, tides and storms. The noise associated with extreme weather is largely the result of the episodic nature of extreme weather events which makes signal detection problematic.

The outputs of the climate models are frequently treated as signals. However, they are actually noise. Each of the many models produces varying outputs depending on the inputs used in each model run, so no individual model produces a signal. Each of the climate models produces different results, even when provided with the same inputs, so the ensemble of models does not produce a signal. This is the result of several factors, including the fact that none of the models have been verified and none have demonstrated predictive capability. The model outputs also vary because of the noise introduced by the ranges of values of the various inputs to the models.

Discussions of “tipping points” are noise, because the conditions required to trigger a “tipping point” are undefined and currently incapable of being defined. This is not to suggest that there is no such thing as a “tipping point’, as illustrated by the major cycles identified in paleoclimatic history. Something caused the earth to descend into the various ice ages; and, something caused the earth to recover from these ice ages. These triggers can be referred to as “tipping points”, though we do not understand what constituted the “tipping point”. In more recent history, we do not know what triggered the Little Ice Age or caused it to end. Politicians frequently warn about future possible “tipping points” being reached but are incapable of identifying the necessary conditions.

Projections of potential future events based on the climate models are also noise, because the outputs of the models are noise. Predictions of permanent droughts, excessive precipitation, stronger or more frequent storms, island submergence, crop failures, the end of snow and the emergence of an ice-free Arctic are noise in the absence of any clear underlying signal.

Efforts to attribute differences between storm frequency and intensity over time to climate change using attribution models are noise, because the models are unverified; and, the various attribution studies estimate very different climate change impacts on the storms studied.

Strident statements regarding the time remaining for precipitous action before a “tipping point” is reached and descriptions of current climate change as a crisis, or an existential threat, are also noise in the absence of a climate signal.

Arguably, the reports of the IPCC working groups, while noisy, are far less noisy that the IPCC Summary for Policymakers. The working group reports are intended to inform, though the information they present is not comprehensive or totally objective. The Summary for Policymakers is intended to influence its audience to incite action, yet another form of “noise”.


Tags: Climate Models, Climate Science

Highlighted Article: How the Green New Deal’s Renewable Energy Mining Would Harm Humans and the Environment

  • 4/23/20 at 06:00 AM


From: The Heartland Institue

By: Paul Driessen

Date: April 2020


How the Green New Deal’s Renewable Energy Mining Would Harm Humans and the Environment


Executive Summary


"The Green New Deal (GND)—promoted by Sen. Bernie Sanders (I-VT), Rep. Alexandria Ocasio-Cortez (D-NY), and several other prominent elected officials—aims to replace all fossil fuels and nuclear energy with so-called “renewable” energy sources, primarily wind and solar.

The justification for this extreme policy proposal is based primarily on the fear that carbon dioxide (CO2) emissions from oil, natural gas, and coal will cause catastrophic global warming, as well as concerns about the alleged dangers of nuclear power sources.

The scientific case that manmade global warming poses an “existential threat” to humanity is highly questionable, according to many scientists, and the safety record for nuclear power in this country thoroughly belies the claims against it.

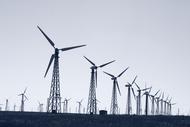
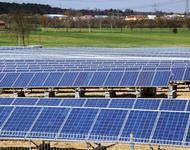
However, what is beyond dispute is that eliminating fossil fuels and nuclear power would require literally millions of wind turbines, billions of solar panels, and several billion batteries like the half-ton power sources used in Tesla vehicles. This, in turn, would require a massive worldwide increase in mining for lithium, cobalt, copper, iron, aluminum, and numerous other raw materials.

Current mining operations to supply materials for today’s comparatively small amount of renewable power technology—plus batteries for laptop computers, smartphones, and electric cars—are already causing supply difficulties and serious problems for the ..."


How the Green New Deal’s Renewable Energy Mining Would Harm Humans and the Environment


Tags: Highlighted Article

Signal / Noise Ratio (Extreme Weather)

“Signal-to-noise ratio (abbreviated SNR or S/N) is a measure used in science and engineering that compares the level of a desired signal to the level of background noise.”, everything.explained.today

In the previous commentaries on signal / “noise” ratio regarding temperature and sea level we discussed ongoing phenomena monitored by frequent measurements which displayed large measurement to measurement “noise” relative to the magnitude of the ongoing phenomena.

In the case of extreme weather, we are dealing with episodic events such as tropical cyclones, tornadoes, floods and droughts. These events are counted and/or measured on a seasonal, annual or multi-year basis, since they occur relatively infrequently. The  frequency of occurrence of these phenomena and their intensity or duration varies widely from year to year, as shown in the bar chart below for tropical cyclones.


North Atlantic Cyclone Activity 1950-2015


There is no clear trend in the data and there are order of magnitude year to year variations.

Tornadoes do not demonstrate the magnitude of year to year variation exhibited by hurricanes. However, they do present an interesting anomaly. Annual tornado reports show a positive trend, in part because of improved reporting of less intense tornadoes. However, the frequency of intense (F3-F5) tornadoes shows a declining trend.


Tornado Reports 1950-2006


The “noise” in the total tornadoes data is significantly greater than in the severe (F2-F5) tornadoes data.

Drought data displays very large variations in drought conditions, but with no trend toward increasing drought frequency, duration or severity.


Average Drought Conditions US 1895-2014


Precipitation data displays characteristics similar to the drought data, as expected, though with a slightly increasing trend.


US Precipitation Oct - Sept


The data for these episodic events, like the data for the near-surface temperature and sea level rise, provide no support for the existence of a crisis or emergency, particularly one caused by anthropogenic climate change.

The magnitude and apparent randomness of the year-to-year variations in these episodic events show no correlation with increasing atmospheric CO2 concentrations, or with the near-surface temperature and sea level rise data, no less any indication of potential causation. The tropical cyclone, drought and precipitation hint at long term cyclical variations, but the length of the data records are short relative to the periods of the major ocean oscillations, for example.

All of this indicates that there is much we do not currently understand about global or regional climate and the natural cycles which influence the climate, clearly indicating that the science is hardly “settled”. However, it does suggest high priority areas for future climate research, including study of the cyclical ocean phenomena such as the Pacific Decadal Oscillation and the Atlantic Multi-decadal Oscillation, both of which are long period phenomena which have not been thoroughly documented over multiple cycles.


Tags: Severe Weather

Guest Post: Environmentalists Should Hope for Quick Economic Rebound

  • 4/17/20 at 09:48 AM

Guest Post

From: International Climate Science Coalition (ICSC)

By: Dr. Jay Lehr and Tom Harris

Across the world, environmentalists are celebrating the huge reduction in air pollution and greenhouse gas emissions that has accompanied the shutdown in economic activities due to the COVID19 pandemic. On April 11th, the UK’s The Guardian newspaper quoted Carolina Urrutia, Bogotá, Columbia’s district environment secretary as saying “Without a doubt this pandemic is helping us improve air quality. With the city shut down, we are able to focus our efforts on other environmental factors.”

Similarly, writing on the Canadian Broadcasting Corporation website (updated on April 7), Canadian environmentalist Dr. David Suzuki cheered the environmental effects of the COVID-19-induced slowdown and asked, "will we celebrate the passing of the pandemic with an orgy of consumption and a drive to get back to the way things were before the crisis?”

Others seem to be taking a similar tack and indeed the COVID-19 emergency is already being presented in some circles as a dry run for the systemwide changes supposedly needed to address climate change.

But this is a serious mistake. No one is encouraging society to engage in "an orgy of consumption," of course. But, for society to properly protect the environment, Suzuki, Urrutia and indeed everyone concerned about the state of our air, land and water should hope that we "get back to the way things were before the crisis." If we can't, then few people will care much about environmental protection.

Only when we are affluent do we have the luxury to engage in environmental protection. While poor communities are usually willing to make sacrifices for some very basic components of environmental improvement such as safe drinking water and waste disposal, greater protections are not often instituted. However, as income rises, citizens raise their environmental goals and willingness to pay for a cleaner environment.

As early as 1943, prominent American psychologist Abraham Maslow showed that, once the basic needs of food, clothing and shelter are met in a society, people may demand less critical options such as greater environmental protection. These might deal with such things as cleaner air and rivers, recreation and the setting aside of protected wildlife areas. These less-personal demands are usually more community-focused. Clearly, with higher incomes, citizens place a greater priority on their environment. This is precisely what happened in America following the post–World War II economic expansion.

This powerful correlation between increasing affluence and the emergence of quality of life issues was first documented in the 1950s by American economist and statistician, Simon Kuznets, the winner of the 1971 Nobel Memorial Prize in Economic Sciences. It led to the development of the Environmental Kuznets Curve (EKC) which shows that, as development begins, environmental degradation increases until a per-capita income tipping point is reached, after which the environment begins to improve.

The EKC was well illustrated by a study by Grossman and Krueger (1995) that showed that air quality tends to deteriorate until per-capita income reaches between $6,000 and $8,000 per year (in 1985 dollars), after which it begins to improve sharply. A study by D. Coursey in 1992, found that the willingness of citizens to spend and sacrifice for a better environment rose twice as fast as per-capita income. Later research has shown similar relationships for a wide range of countries and various measures of environmental protection.

There is not a single EKC relationship between wealth and environmental improvement for all pollutants, places and times, of course, but the general relationship is always closely adhered to.

Strident environmentalists have long ignored, misunderstood or downplayed these issues. They instead have mistakenly viewed economic growth as the cause rather than the solution to environmental problems.

Factors such as strength of democratic institutions, levels of educational achievement, and income equality also play important roles in environmental protection.However, prosperity obviously has a beneficial effect on these variables. It is essentially a positive feedback mechanism.

In the final analysis, the productivity and wealth of nations depends more on their institutions, laws, incentives and regulations than on their natural resources. Countries where private property rights are defined, protected and tradable have significantly greater per capita wealth, economic growth rates and rising standards of public health along with environmental quality. Clearly, environmentalists, David Suzuki and Carolina Urrutia included, should be hoping our economies rebound quickly after the immediate crisis.

Tags: Guest Post

Secret Science

US EPA has revised its rules regarding the use of “secret science” in its rulemaking processes. The revised rule now gives preference to scientific studies for which underlying data and models are available in sufficient detail to permit independent validation. This revision softens the position regarding reliance on “secret science”, largely in response to concerns about the security of study data which would permit identification of study participants. However, in almost all cases, the identity of study subjects could be protected while still providing sufficient study detail to permit validation of study methods and conclusions.

This EPA rulemaking draws attention to the broader issue of providing access to study data and models on scientific studies which do not involve human subjects. There is an acknowledged reproducibility crisis in science not limited to EPA epidemiological research. EPA has begun to address the issue, but it is long past time for other research funding agencies to address the issue as well.

Government funding agencies are in a strong position to address the issue. Requests for Proposals (RFPs) can stipulate that all study methods, data, analytical approaches and models be publicly disclosed at the conclusion of the specific project. Compliance could be assured by conditioning final payment on acceptable disclosure as stipulated in the RFP.

Scientific journals are also in a strong position. Journals can refuse to submit research papers for peer review unless acceptable disclosure has occurred. Journals can also refuse to publish research papers if peer reviewers are not satisfied with the authors’ disclosures. How is meaningful peer review possible if the reviewers do not have access to study methods, data, analytical approaches and models? Journals can also increase confidence in the peer review process by including a skeptical peer among the reviewers and avoiding “pal review”, especially the practice of allowing authors to select the peers they wish to review their work.

Privately funded research could also be subjected to rigorous peer review through the use of Non-Disclosure Agreements (NDAs), though this is more problematic. However, corporations planning major investments to commercialize the results of their research might well encourage critical peer review prior to investment decisions. Corporations also face potential legal liability if they produce ineffective or dangerous products resulting from their research.

The broader scientific community should insist on more thorough disclosure and more rigorous peer review to reverse the current irreproducibility crisis and avoid major issues in the future.

The climate science community should be particularly sensitive to these issues, as should the government agencies funding climate science research. The refusal of noted climate scientists to provide disclosure regarding controversial results, such as the infamous “hockey stick”, and the stated willingness of other climate scientists to “lose data” rather than sharing the data with skeptical scientists are clear indications of potential problems in the climate science community. Efforts to prevent the publication of research results which do not support the consensus narrative, the exclusion of such research results from consideration in the IPCC Assessment Reports and attempts to delegitimize skeptical scientists are further indications of problems in climate science.


Tags: Secret Science, EPA, Peer Review, Policy

Signal / Noise Ratio (Sea Level)

“Signal-to-noise ratio (abbreviated SNR or S/N) is a measure used in science and engineering that compares the level of a desired signal to the level of background noise.”, everything.explained.today


Another of the primary focuses of climate science is the global sea level and particularly the rate of global sea level increase and any acceleration in that rate of increase. The long historical record of sea level increase has been established using tide gauges along the oceans’ shorelines. More recently, global sea level rise is being measured using satellites in polar orbit which completely scan the oceans every ten days. The tide gauge records indicate a rate of sea level rise of approximately 1.8 mm per year. The satellite records indicate a rate of rise of approximately 3.4 mm per year.

These measured rates are obviously different, but it must be remembered that they are measuring different things and at different frequencies. The measurement of greatest interest is the sea level rise at the shorelines, where the oceans meet populations and their infrastructure. The graph below shows the historic sea level rise at a location in coastal Virginia since 1920, as measured by local tide gauges. The legend on the graph identifies the uncertainty in the measurement of +/- 0.22 mm [per year. However, the uncertainty in the monthly average measurements is +/- 5 mm.


NOAA Sea Level Data and Trend


The annual rate of sea level rise at this site is well above the average, but it still is significantly lower than the monthly “noise”, which ranges up to approximately 300 mm. One of the contributors to this above average rate of sea level rise is subsidence of the land along the shoreline as a result of unstable soils and groundwater extraction.

The graph below shows the global sea level rise measured by satellite. Again, note the “noise” in the data relative to the annual change. This noise is largely the result of the continuously changing surface condition of the oceans, which range from ripples to swells to waves of varying heights, depending on wind and storm conditions.


Satellite-based Global Sea Level Change


The satellite record currently exceeds 30 years, so that it can be used as a climate reference period. However, it must be noted that the uncertainty of the individual satellite scans of sea level is +/- 4 mm, which is very similar to the uncertainty of the tide gauge records and larger than the annual rate of sea level rise, which is indicative of a very low signal to noise ratio.

There is a high level of interest within the climate science community regarding any potential increase in the historical rate of sea level rise. There is no indication of acceleration in the tide gauge data, though some researchers believe there is such an indication in the satellite data, though the satellite record is quite short. However, the magnitude of the suggested increase in the rate of sea level rise is approximately an order of magnitude less than the annual rate of sea level rise, making it far more difficult to determine against the background “noise”.


Tags: Sea Level Rise, Sea Level Change

Signal / Noise Ratio (Temperature)

“Signal-to-noise ratio (abbreviated SNR or S/N) is a measure used in science and engineering that compares the level of a desired signal to the level of background noise.”, everything.explained.today


One of the primary focuses of climate science is the change in global near-surface temperature, particularly the changing anomaly between current global near-surface temperature and the average global near-surface temperature during a reference climate period.


US Jan-Dec Average Temperature Anomaly


The graph above shows the annual average near-surface temperature for the contiguous United States, as measured by the US CRN weather stations, over the entire period of operation of the CRN through 2018. The “signal” climatologists are seeking is the long-term average rate of increase of near-surface temperature, or the long-term average rate of increase of the anomaly relative to the climate reference period. In the graph above, the increase in the annual anomaly over the 14-year period from 2005-2018 appears to be approximately 0.1°C, or 0.07°C per decade.

In this graph, the individual annual anomalies vary over a range of approximately 1.7°C, or approximately 17 times total change in the average anomaly over the period of operation of the US CRN. The rate of change of the annual average anomalies varies from approximately 0.1°C per year to approximately 1.6°C per year. This is the “noise” from which the long-term anomaly “signal” must be distinguished. This represents a formidably low “signal” to “noise” ratio.


US Average Temperature Anomaly


The graph above, also from NOAA, shows the monthly anomaly values for the entire period of operation of the US CRN through July 2019. This graph also includes a plotted trend line for the period, showing an increase of approximately 0.5°C over the 14.5-year period. This is a significantly higher rate of increase than is indicated by the annual average values in the previous graph. Note also the extent to which annual averaging diminishes the relative magnitude of the “noise”; and, that the rate of change of the monthly anomalies ranges up to 4°C per month.


US Jan-Dec Average Temperature Anomaly


The graph above displays the annual average anomalies for the contiguous US over the period from 1988 through 2018. The anomalies for the period from 1988 through 2005 are from the US Historical Climatology Network, which are also shown overlaid on the US CRN values for the period 2005-2012. The total annual anomalies vary over a range of approximately 2.2°C. In the graph above, the increase in the annual anomaly over the 30-year period appears to be approximately 0.7°C, or approximately 0.23°C per decade. This is approximately 3 times the rate of increase over the final 14 years of the period.

These differences highlight the importance of the period selected for analysis, especially in a situation in which the “signal” to “noise” ratio is substantially less than 1. It is also important to note that the US CRN values are unadjusted, while the US HCN values are “adjusted” in an attempt to correct biases and errors in the raw data. It is reasonable to assume that the close match between the US CRN values and the US HCN values over the period of overlap from 2005-2012 is the result of “adjustments” to the US HCN data.

The magnitude of the anomaly variations (“noise”) over the period relative to the magnitude of the warming ”signal” is a clear illustration of the effects of natural variations in the earth’s weather relative to the magnitude of the “forced” climate warming.


Tags: Temperature Record, US Climate Reference Network (CRN)

Highlighted Article: When 'Climate' Isn't About the Climate At All

  • 3/26/20 at 06:00 AM


From: The Pipeline

By: Christopher Horner

Date: February 19, 2020


When 'Climate' Isn't About the Climate At All


"Opinion polls confirm that “climate change” is still valiantly holding on in its fight to remain dead as an issue of actionable public concern. Some state attorneys general claim this is because of dark forces, and they will use their law enforcement powers to ensure the public hears only the one, sanctioned Truth. Ominous threats aside, reasons for the rejection are sometimes humorous – polls also show that the public feels it's doing its part by recycling and turning off the lights when leaving a room, so why lard big energy taxes on top?

Still, “climate” is where both parties’ donor bases are. It is an inescapable litmus test for the Democratic party’s increasingly left-wing base. So candidates for the Democratic nomination for president shout about climate being the “challenge of our time,” and “the greatest threat to our national security.”

Spoiler alert: It isn’t." ...


When 'Climate' Isn't About the Climate At All


Tags: Highlighted Article

Desperation

The 1970s were the decade of global cooling, hyped in the media with cover art and major articles in Time, Newsweek and other media outlets. Scientists were also concerned about global warming during that period, but the actual cooling which was occurring could not be ignored. Since then, the focus of attention has been on global warming and later on the broader issues of climate change, including: sea level rise; drought and excess precipitation frequency, intensity and duration; tropical cyclone frequency and intensity; tornado frequency and intensity; receding glaciers; and, declining Arctic and Antarctic sea ice.

Since the early 1980s, there has been a growing effort on the part of climate scientists, many national governments and the United Nations to raise public consciousness and concern regarding global warming and climate change. The UNFCCC has held annual Conferences of the Parties (COP) to develop and coordinate international efforts to halt and ultimately reverse observed changes in the global climate. These COPs have received extensive media coverage of their expressed concerns regarding future climate change and their proposed approaches to dealing with the changing climate and its effects.

The IPCC has produced five Assessment Reports prepared by participating scientists, dealing with the perceived causes of the observed climate change and the perceived effects of the changes which had already occurred and the anticipated future changes. These reports were accompanied by a Summary for Policymakers, prepared by non-scientists, to guide policymakers and provide fodder for the global media. National governments funded climate studies for inclusion in the IPCC Assessment Reports and the development of climate models to be used to project future climate changes.

The climate sensitivity, forcing and feedback information developed for the IPCC reports were combined with Representative Concentration Pathways (RCP) in the computer models to develop scary scenarios of potential future climate changes, typically based on the RCP8.5 scenario, which represented the highest projected emissions pathways forward. These scenarios were intended to arouse public awareness of and concern about climate change, so that the public would perceive climate change as a potential threat and agree to support government actions to halt and reverse climate change. These efforts have so far been relatively unsuccessful; and, climate change remains of little concern to most of the public, based on repeated surveys regarding issues of concern.

Several governments have attempted to get ahead of the public concern, instituting climate taxes and activity restrictions. These efforts have been met with aggressive public resistance, including the “yellow vest” demonstrations in France and the demonstrations in Chile which caused the relocation of COP25 from Chile to Spain. Numerous efforts to pass climate-related taxes in the US have been defeated at the ballot box.

This general failure to raise public awareness, concern and willingness to sacrifice has frustrated governments and environmental activists. This frustration has led to massive demonstrations by environmental activist groups, most notably the Extinction Rebellion, some of which have resulted in property damage and personal violence. Even more concerning than these demonstrations is the apparent unwillingness of some governments to appropriately manage the demonstrations in the interest of public safety. There appears to be a growing unwillingness on the part of some government agencies to arrest and prosecute those directly responsible for personal injury and property damage during these demonstrations, as well as to protect journalists and others not among the demonstrators.

There is some concern that these uncontrolled demonstrations could lead to anarchy on a broader scale. The angry, desperate, sponsored activism of agitators such as Greta Thunberg makes this outcome more likely, particularly in light of the unwillingness of government representatives to question her actions and motives. The streets are not the proper venue for rational climate discussion and debate. Government ignores that at our peril.


Tags: IPCC, Protests, COP - Conference of Parties, Representative Concentration Pathway (RCP)

Impound More Water

The total quantity of water in the earth system, in all physical states and in all locations, is fixed (with the exception of water vapor emitted by the combustion of hydrocarbons, which is relatively trivial). The vast majority of this water exists as saltwater in the globe’s oceans. Most of the remainder exists as freshwater in glaciers, snow fields, land and sea ice, aquifers, lakes, rivers and streams or as brackish water at the interfaces between fresh water sources and the oceans.

Accessible freshwater resources provide water for residential, commercial, institutional and industrial consumption and for agricultural irrigation. These resources are replaced by precipitation, although that replacement is not always contemporaneous or complete. The result can be excessive precipitation and flooding, or insufficient precipitation and drought. These situations can be adapted to with the construction of additional water impoundments, such as artificial lakes and reservoirs.

Many areas on the globe are exposed to very large variations in precipitation on a seasonal basis, such as the monsoon, hurricane and typhoon seasons in many nations, the impacts of El Nino and La Nina events and the snow melt at the end of winter. In many cases, failure to impound the large quantities of water made available during these events result in both flooding during the events and inadequate water supplies between the events. These situations are exacerbated by increasing population, which puts additional pressure on resources and also increases the percentage of impervious surfaces, which increase and accelerate runoff.

In coastal regions which rely on aquifers for significant portions of their freshwater supplies, land subsidence has become a growing issue which has aggravated the effects of rising sea levels. This has been an issue along the US East Coast, specifically around Norfolk, Virginia and Miami, Florida. It is also an issue on the US Gulf Coast, specifically in the Mississippi Delta around New Orleans, Louisiana. Some areas have installed reinjection pumps to move surface water into the aquifers to restore capacity and avoid or minimize subsidence.

California has experienced rapid population growth over the past 50 years, However, it has not built a new reservoir during that period. This has resulted in significant pressure on water resources during normal years and rationing during periods of drought, which are frequent since much of California is desert. Then, in recent years, there has been greater than average rainfall and snowfall, much of which has flowed unused to the sea rather than being stored for use in the inevitable periods of drought. Water rationing has begun to impact California agriculture, causing large orchards and farms to be abandoned.

It is clearly time to move from a sole focus on climate change mitigation to a broader focus which includes significant adaptation efforts. Water should be a high priority focus of these adaptation efforts, with regard to both increasing impoundment for future use and more effectively channeling water which cannot be impounded.


Tags: Climate Change Adaptation

Highlighted Article: On Cambridge University, post-modernism, climate change, Oppenheimer’s Razor, and the Re-Enlightenment

  • 3/12/20 at 06:00 AM


From: Watts Up With That?

By: Neil Lock

Date: February 29, 2020


On Cambridge University, post-modernism, climate change, Oppenheimer’s Razor, and the Re-Enlightenment


"In the early 1970s, I studied mathematics at Trinity College, Cambridge. I enjoyed it at the time, but was left with a feeling that something wasn’t quite right. Although I scraped a First, and was offered a place on Part III of the Tripos, I decided to go out into the real world instead. Never did I make a better life decision.

Over the intervening decades, I have come more and more to question the value of universities. I would have expected the remit of a university to be (1) to seek, (2) to develop, and (3) to pass on, ideas and practices to improve the human condition, both today and in the future. There should be no dishonesties in their processes, no imposed orthodoxies, and no restrictions on the freedom to seek, or to tell, the truth. Yet, universities – not just at Cambridge, but world-wide – seem to have become bastions of political correctness. Anyone in the faculty, who doesn’t toe the party line and parrot the narrative of the moment, will find difficulties in funding or in getting papers published, or may even be in danger of dismissal. Peter Ridd in Australia and Susan Crockford in Canada are topical examples.

CAM
Today, Cambridge University seeks assiduously to cultivate its alumni; for the purpose of donations, no doubt. And they do this through a glossy called CAM (Cambridge Alumni Magazine), which they send out three times yearly. To a mailing list which includes me.

I confess that, for me, CAM has previous. In 2016 [[1]] it published what I can only describe as a full-page ad for nanny-statism. This article talked of: “increasing support for interventions – often by governments – to forcibly change environments to make easier the healthier behaviours that many of us prefer.” And of “how to increase public demand for such interventions.” Yet the author, Professor Theresa Marteau, stands high in the favour of the UK’s current ruling class. Even having, in 2017, been made a Dame Commander of the British Empire." ...


On Cambridge University, post-modernism, climate change, Oppenheimer’s Razor, and the Re-Enlightenment


Tags: Highlighted Article
Search Older Blog Posts