Call or complete the form to contact us for details and to book directly with us
435-425-3414
435-691-4384
888-854-5871 (Toll-free USA)


Contact Owner

*Name
*Email
Phone
Comment
 
Skip to Primary Navigation Skip to Primary Content Skip to Footer Navigation
▽ Explore More ▽ Hide

Climate and Climate Change

Climate and Climate Change

Climate Change

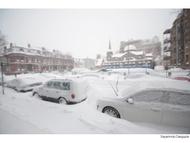
Two days before Halloween, 2011, New England was struck by a freak winter storm. Heavy snow descended onto trees covered with leaves.  Overloaded branches fell on power lines.  Blue flashes of light in the sky indicated exploding transformers.  Electricity was out for days in some areas and for weeks in others. Damage to property and disruption of lives was widespread.

That disastrous restriction on human energy supplies was produced by Nature.  However, current and future energy curtailments are being forced on the populace by Federal policies in the name of dangerous “climate change/global warming”.  Yet, despite the contradictions between what people are being told and what people have seen and can see about the weather and about the climate, they continue to be effectively steered away from the knowledge of such contradictions to focus on the claimed disaster effects of  “climate change/global warming” (AGW, “Anthropogenic Global Warming”). 

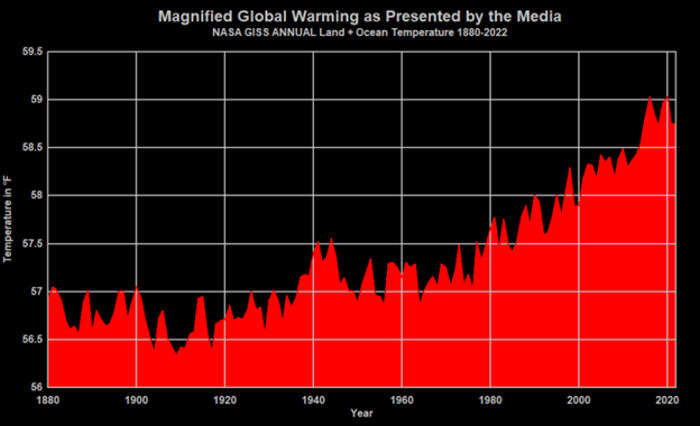
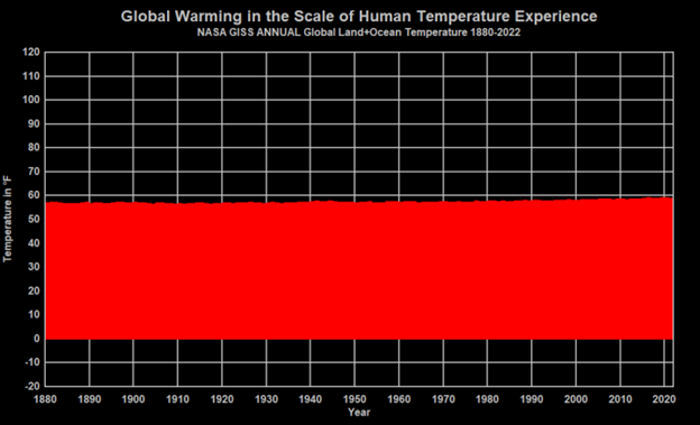
People are seldom told HOW MUCH is the increase of temperatures or that there has been no increase in globally averaged temperature for over 18 years.  They are seldom told how miniscule is that increase compared to swings in daily temperatures. They are seldom told about the dangerous effects of government policies on their supply of “base load” energy — the uninterrupted energy that citizens depend on 24/7 — or about the consequences of forced curtailment of industry-wide energy production with its hindrance of production of their and their family’s food, shelter, and clothing. People are, in essence, kept mostly ignorant about the OTHER SIDE of the AGW debate.

Major scientific organizations — once devoted to the consistent pursuit of understanding the natural world — have compromised their integrity and diverted membership dues in support of some administrators’ AGW agenda.   Schools throughout the United States continue to engage in relentless AGW indoctrination of  students, from kindergarten through university.  Governments worldwide have been appropriating vast sums for “scientific” research, attempting to convince the populace that the use of fossil fuels must be severely curtailed to “save the planet.”  Prominent businesses — in league with various politicians who pour ever more citizen earnings into schemes such as ethanol in gasoline, solar panels, and wind turbines — continue to tilt against imaginary threats of AGW.  And even religious leaders and organizations have joined in to proclaim such threats.   As a consequence, AGW propaganda is proving to be an extraordinary vehicle for the exponential expansion of government power over the lives of its citizens. 

Reasoning is hindered by minds frequently in a state of alarm.  The object of this website is an attempt to promote a reasoned approach; to let people know of issues pertaining to the other side of the AGW issue and the ways in which it conflicts with the widespread side of AGW alarm (AGWA, for short).  In that way it is hoped that all members of society can make informed decisions.

Implications of the Linear Carbon Sink Model - Highlighted Article

  • 8/22/24 at 06:00 AM


From: Climate Etc.

By: Joachim Dengler

Date: July 10, 2024


Implications of the Linear Carbon Sink Model


This post is the first of two extracts from the paper Improvements and Extension of the Linear Carbon Sink Model.


Introduction – Modelling the Carbon Cycle of the Atmosphere

When a complex system is analyzed, there are two possible approaches. The bottom-up approach investigates the individual components, studies their behavior, creates models of these components, and puts them together, in order to simulate the complex system. The top-down approach looks at the complex system as a whole and studies the way that the system responds to external signals, in the hope to find known patterns that allow conclusions to be drawn about the inner structure.

The relation between anthropogenic carbon emissions, CO2 concentration, and the carbon cycle has in the past mainly been investigated with the bottom-up approach. The focus of interest are carbon sinks, the processes that reduce the atmospheric CO2 concentration considerably below the level that would have been reached, if all CO2 remained in the atmosphere. There are three types of sinks that absorb CO2 from the atmosphere: physical oceanic absorption, the photosynthesis of land plants, and the photosynthesis of phytoplankton in the oceans. Although the mechanisms of carbon uptake are well understood in principle, there are model assumptions that cause divergent results.

The traditional bottom-up approaches are typically box-models, where the atmosphere, the top layer of the ocean (the mixed layer), the deep ocean, and land vegetation are considered to be boxes of certain sizes and carbon exchange rates between them. These models contain lots of parameters, which characterize the sizes of the boxes and the exchange rate between them. The currently favored model is the Bern box diffusion model, where the deep ocean only communicates by a diffusion process with the mixed layer, slowing down the downwelling carbon sink rate so much, that according to the model 20% of all anthropogenic emissions remain in the atmosphere for more than 1000 years. (continue reading)


Implications of the Linear Carbon Sink Model


Tags: Highlighted Article

Green Railroads - ORIGINAL CONTENT

All freight rail and most long-distance passenger rail is powered by Diesel-electric locomotives. Some short-distance passenger rail (commuter rail) is powered by electric locomotives. Light rail is typically powered electrically, as are subway systems.

Decarbonization of the rail sector and the transition to “all-electric everything” would require replacement of Diesel-electric locomotives with electric locomotives or locomotives fueled by Green Hydrogen.

The technology required to electrify freight rail is currently available, though it would need to be adapted to the more stringent requirements of freight rail. Long freight trains frequently use two to four 3,000 – 4,000 kW locomotives, which would determine the required current capacity of the overhead power lines. Freight rail is not suitable for the application of third-rail power supply because of the unrestricted access to the railbed.

The US Class 1 rail system comprises approximately 90,000 miles of track. Cost estimates for the electrification of freight rail vary widely depending on terrain, but would likely exceed $1,000,000 per mile, which would result in an investment requirement exceeding $90 billion, not including the investment in the electric generation and storage capacity required to reliably power the system. Conversion of other classes of rail systems would add additional costs.

There are also efforts underway to develop battery powered electric locomotives. These would likely be restricted to railyard and railcar placement duty and could be recharged from extensions of the overhead power lines in railyards. The locomotives could be paired with tenders holding larger batteries to extend their range.

Hydrogen could be used to fuel either Otto-cycle or Diesel-cycle combustion engines to power electric alternators or generators. However, the most efficient approach would be direct electric conversion in Hydrogen fuel cells. Each locomotive would be paired with a fuel tender carrying approximately 20,000 gallons of liquid Hydrogen for long-haul service. Railyard and railcar placement locomotives could use onboard fuel storage.

The technology required to produce a liquid Hydrogen fueled railroad locomotive largely already exists, with the exception of a durable, long-life 3,000 – 4,000 kW hydrogen fuel cell suitable for railroad application. Argonne National Laboratories is leading a project to develop a Hydrogen fuel cell powered locomotive. Matching the cost and durability of the Diesel engines with fuel cells is a major technical challenge. Matching the cost of Diesel fuel with liquid Green Hydrogen is also a major challenge, since Green Hydrogen is currently more than three times the cost of Diesel fuel.

It is difficult to estimate the investment required to store liquid Hydrogen throughout the Class 1 rail system and the investment required to transport the liquid Hydrogen from the liquefaction plants to the rail system storage facilities. Transportation of liquid Hydrogen at that scale is unprecedented and untested.

It is very likely that a liquid Hydrogen fuel system for the rail sector would be part of a larger system to produce Green Hydrogen for use as a long-duration energy storage medium, although the liquefaction facilities would be specific to the rail sector.


Tags: Green Transportation, Green Energy Transition

Hunga Tonga volcano: impact on record warming - Highlighted Article

  • 8/15/24 at 06:00 AM


From: Climate Etc.

By: Javier Vinós

Date: July 5, 2024


Hunga Tonga volcano: impact on record warming


The climate event of 2023 was truly exceptional, but the prevailing catastrophism about climate change hinders its proper scientific analysis. I present arguments that support the view that we are facing an extraordinary and extremely rare natural event in climate history.


1. Off-scale warming

Since the planet has been warming for 200 years, and our global records are even more recent, every few years a new warmest year in history is recorded. Despite all the publicity given each time it happens, it would really be news if it didn’t happen, as it did between 1998 and 2014, a period popularly known as the pause.


Figure 1. Berkeley Earth temperature anomaly


Since 1980, 13 years have broken the temperature record. So, what is so special about the 2023 record and the expected 2024 record? For starters, 2023 broke the record by the largest margin in records, 0.17°C. This may not sound like much, but if all records were by this margin, we would go from +1.5°C to +2°C in just 10 years, and reach +3°C 20 years later. (continue reading)


Hunga Tonga volcano: impact on record warming


Tags: Highlighted Article

Grid Load Shaping - ORIGINAL CONTENT

The US electric utility grid has typically operated at a load factor of approximately 40% of peak demand. US utility scale generating capacity in 2023 was 1,141 GW, of which 341 GW were renewable generation. The nominal annual potential generation from this generation fleet would be 9995 TWH (1141 GW * 8760 hrs/yr). However, 252 GW of the generating capacity consisted of intermittent renewables with a capacity factor of approximately 30%, reducing the expected total annual generation potential to approximately 8,450 TWH. Therefore, the actual load factor on the grid was approximately 47%.
 
The Administration’s intent to transition the US energy economy to “all-electric everything” would require a rough tripling of electric generation and of the capacity of the electric grid. However, achieving an additional 17,000 TWH of generation potential with intermittent renewables would require installation of approximately 6,000 GW of additional intermittent renewable generation plus the storage capacity required to render the intermittent generation dispatchable.

The additional intermittent generation capacity required is sensitive to the round-trip efficiency of the supporting storage. Current battery storage has a round-trip efficiency of 90+%. However, Green Hydrogen storage has a round-trip efficiency closer to 50%, which would require additional generation capacity to compensate for the higher round-trip energy losses.

Significant reductions in the required expansion of grid capacity would be possible if the load factor on the grid could be increased by shaping the grid demand profile. However, it is unlikely that the grid load factor could be increased beyond 60% without significant disruptions, such as rotating blackouts and the activation of virtual powerplants. Utilities and regulatory commissions have attempted to use tools such as demand-side management, time-of-day rates, demand charges and interruptible rates to shape grid demand profiles, with limited success.

US DOE has produced a document entitled “Decarbonizing the U.S. Economy by 2050: A National Blueprint for the Buildings Sector” which outlines several approaches to shaping the electricity demand profiles for the buildings sector. No such document has been produced for the other sectors of the economy, particularly the industrial sector, in which massive transitions from direct fossil fuel end uses to electric end uses would be required to occur. In many cases, the required electric end use technologies do not currently exist or are in their infancy.

There is also no blueprint for the transportation sector, particularly medium and heavy-duty trucks and railroads. Commercialization of EV medium and heavy-duty trucks is in its infancy. There is significant concern about vehicle range and about the increased vehicle weight and its effect on allowable cargo loads. There is also interest in Green Hydrogen as a medium and heavy-duty truck fuel, although its cost appears to be prohibitive.

Passenger rail and light rail electrification is an established technology for densely populated inter-urban transportation corridors and urban mass transit. However, electrification has not been applied to long-haul freight operations, which involve both longer distances and much heavier loads.  

The data on which this analysis is based may be found in the following tables in the EIA Annual Energy Outlook 2023.
Table: Table 9. Electricity Generating Capacity
Table: Table 10. Electricity Trade
Table: Table 16. Renewable Energy Generating Capacity and Generation


Tags: Green Energy Transition, Electric Power Generation, Electric Power Reliability

Our Coming Energy Famine - Highlighted Article

  • 8/8/24 at 06:00 AM


From: National Review

By: Mario Loyola

Date: June 13, 2024


Our Coming Energy Famine


Economic change and Biden’s hostility to fossil fuels are setting up an electricity crisis
Most Americans are unaware of a grave danger looming on the horizon: a historic — and entirely self-inflicted — energy-scarcity crisis. The “transition from fossil fuels” presupposes that “clean energy” substitutes will be ready when needed. But while the war on fossil fuels is making real gains, at least in the electricity sector, the effort to deploy renewable substitutes is failing catastrophically. Add soaring demand, and America is facing the worst energy shortfall in its history.

The nation’s grid regulators are already sounding the alarm. “I am extremely concerned about the pace of retirements we are seeing of generators which are ... (continue reading)


Our Coming Energy Famine


Tags: Highlighted Article

The Internet of Things - ORIGINAL CONTENT

The Internet of Things refers to the variety of devices which are remotely accessible from the internet. At their most basic, these devices include wall switches, electrical outlets and plug-in outlet adaptors which can be used to power connected devices on a predetermined schedule or remotely at will.

Electronic heating and cooling thermostats can also be connected, allowing remote access to change equipment operating schedules, temperature setpoints and other system settings.

High efficiency electric heat pump water heaters, laundry dryers and induction ranges have also been added to the internet of things.

Security systems are now also accessible from the internet, allowing the systems to be set remotely to secure and unsecure the property and to remotely authorize secure access to the property. Garage door operators are also available in internet connected versions.

While these functions of the Internet of Things (IOT) were intended to provide owner/occupant convenience, they also provide an opportunity for others, including utilities and government to control energy end uses remotely in response to high grid demand or low renewable energy availability. The Internet of Things could be used to interrupt the operation of building heating and cooling systems or to limit those systems to low-capacity operation, or to adjust the set temperatures to reduce demand or to enforce minimum and maximum temperature control settings. It could also be used to prevent the operation of water heating systems or laundry equipment during periods of high demand or low energy availability.

In installations including solar photovoltaic collectors, solar storage batteries and electric vehicles and chargers, the IOT could also be used to direct solar collector output to the grid and to direct stored solar energy in on-site batteries to the grid. The IOT could also be used to control the operation of EV charging systems to periods of low grid demand and to direct energy stored in EV batteries to the grid when needed.

While this flexibility to control individual customer energy use might be useful to utilities forced to rely on intermittent renewable generation plus storage to meet grid demand, it also represents the potential to interfere with the lifestyles of individual residential customers and the operation of the businesses of commercial and industrial customers. EV owners could be faced with the situation in which they could not drive to work on a given day because the grid had drawn down the charge in their EV battery. Solar customers could also be faced with the unavailability of power from their on-site storage batteries in the event of a power failure because the grid has drawn charge from those batteries.

These issues are clearly a concern because of the perceived need to minimize the investment in renewable generating capacity, grid-scale storage, transmission and distribution capacity and “last mile” transformer, service line and building electrical system capacity.

The issue is further complicated by the federal focus on providing advantages to disadvantaged communities, which would almost certainly result in applying disadvantages to advantageed communities in what appears to be a zero sum game, or perhaps even a negative sum game.


Tags: Regulation

The Battle of Climate Hypotheses: The Green-House Gas Forcer Vs. The Winter Gatekeeper Round 3: The Two Arctic Paradoxes - Highlighted Article

  • 8/1/24 at 06:00 AM


From: Watts Up With That

By: Gabriel Oxenstierna

Date: June 18, 2024


The Battle of Climate Hypotheses: The Green-House Gas Forcer Vs. The Winter Gatekeeper Round 3: The Two Arctic Paradoxes


For the first time, the IPCC’s doctrine of CO2 as a ‘control knob’ in our climate faces a serious challenger in the form of a comprehensive hypothesis about what drives climate and its shifts.[1][2] This article is the third in a series evaluating this new hypothesis of natural climate variability.

The Arctic [70-90°N] is a real focal point for the climate, as well as for the two competing climate hypotheses. It has warmed 3-4 times faster than the globe since 1979, and is by far the region with the highest rate of warming.[3] This phenomenon started in the late 1990s and is mainly seen during winter:

Figure 1. The AA is mainly a winter phenomenon (blue curve) in the highest latitudes, 80 – 90°N. Temperature anomalies compared to a 30-year comparison period. The ‘1997’ shift period is marked with a yellow bar. Image source: DMI

For the “Winter Gate-keeper hypothesis” [WGH], the Arctic is particularly important: The weak and sensitive polar vortex there allows for large variations in poleward heat transport that it claims regulates the climate, much like a control knob.[1, p.542] Energy is transported to the Arctic in order to get radiated from there, where radiation is as most efficient – not least due to a low green-house effect [GHE].

When heat is moved to a location where it can be more easily radiated to space, the outgoing radiation increases, leading to a reduction in the energy content of the system. Changes in transport of heat and humidity up to the Arctic explain both the strong warming trend in the Arctic and its effects on global warming, according to WGH. This is especially the case during the dark polar winter, which is why we see the pattern in figure 1. Cf. the first post in this series, here.

The Green-house Gas Forcer hypothesis says that Arctic warming primarily is caused by the increased amount of anthropogenic GHGs in the atmosphere (CO2 etc.).[5] These increase the GHE, which is assumed to cause the large temperature increase in the Arctic. The GHE-driven warming in the Arctic has even been given its own name: “Arctic Amplification” [AA]. This is IPCC’s take on the relationships: (continue reading)


The Battle of Climate Hypotheses: The Green-House Gas Forcer Vs. The Winter Gatekeeper Round 3: The Two Arctic Paradoxes


Tags: Highlighted Article

Societal Cost - ORIGINAL CONTENT

The energy transition currently being pursued by the current Administration imposes several types of societal costs, many of which are ignored.

The cessation of fossil fuel use would strand approximately $60 trillion of coal, oil and natural gas resources, depriving the owners of those resources of their profitable sale and depriving the nation of their beneficial use.

The replacement of natural gas end uses with electric end uses would result in abandonment of billions of dollars of natural gas production, transmission and distribution infrastructure. It would also require development of additional electric generation, transmission and distribution infrastructure. The replacement of oil and gasoline end uses with electric end uses would result in abandonment of oil production, refining and distribution infrastructure and require further increases in electric infrastructure.

Consumer replacement of typical gas and electric appliances and equipment with high efficiency electric appliances and equipment such as heat pumps, heat pump water heaters, heat pump laundry dryers and induction ranges adds significant consumer cost, as those appliances are approximately twice as expensive as their conventional counterparts. While it is true that these high efficiency appliances would offer lower operating costs than their conventional counterparts, it is questionable whether their higher costs would be recovered through energy cost savings over their useful lives.

Upgrading residential and commercial buildings to reduce their energy consumption by the DOE 50% target would be extremely expensive and it is doubtful that the cost would be recovered through energy savings. Replacing windows in buildings with windows which reduce undesirable heat gain and heat loss is particularly expensive. It is also a classic case of “broken window economics”.

Adding solar photovoltaic collectors to those residential and commercial buildings which are suitably oriented for such installations is also expensive, as is the addition of storage batteries to store solar generated electricity for later use.

Replacing ICE vehicles with electric vehicles also involves a significant cost premium, as well as a reduction in vehicle utility. It would also require significant electric generation, transmission and distribution investment as well as electric service upgrades to support vehicle chargers.

Interestingly, DOE’s Decarbonizing the U.S. Economy by 2050: A National Blueprint for the Buildings Sector views the storage batteries in both electric vehicles and building solar installations as “generators”, available to supply power to the grid during periods of peak demand or reduced renewable generation output, potentially reducing the value of these assets to their owners.

It is unclear the extent to which government would choose to incentivize the above actions or subsidize the incremental costs. However, while such government actions might reduce the direct costs of the actions for individual building owners or vehicle purchasers, they would not reduce the societal costs of the actions.

The current situation with electric vehicles provides a compelling societal cost example. If a vehicle manufacturer prices a vehicle at approximately $60,000 and experiences a loss of approximately $60,000 on each vehicle sold and the government offers an approximate $7,500 subsidy for each vehicle purchased by an ultimate consumer, the ultimate consumer pays approximately $52,500 for the vehicle, but the societal cost of the vehicle is approximately $120,000 ($52,500 + $7,500 + $60,000). Actually, the societal cost is higher, whether the government subsidy is paid from tax revenues or from borrowing, because of the administrative costs incurred by the government and, in the case of borrowed funds, because of the interest expense over the life of the financial instrument.


Tags: Green Energy Transition, Fossil Fuel Elimination / Reduction

Net Zero Averted Temperature Increase - Highlighted Article

  • 7/25/24 at 06:00 AM


From: CO2 Coalition

By: R. Lindzen, W. Happer, and W. A. van Wijngaarden

Date: June 11, 2024


Net Zero Averted Temperature Increase


June 2024

Many people are surprised by how little warming would be averted from adoption of net zero policies. For example, if the United States achieved net zero emissions of carbon dioxide by the year 2050, only a few hundredths of a degree Celsius of warming would be averted. This could barely be detected by our best instruments.  The fundamental reason is that warming by atmospheric carbon dioxide is heavily “saturated,” with each additional ton of atmospheric carbon dioxide producing less warming than the previous ton.

Abstract:

Using feedback-free estimates of the warming by increased atmospheric carbon dioxide (CO2) and observed rates of increase, we estimate that if the United States (U.S.) eliminated net CO2 emissions by the year 2050, this would avert a warming of 0.0084 ?C (0.015 ?F), which is below our ability to accurately measure. If the entire world forced net zero CO2 emissions by the year 2050, a warming of only 0.070 ?C (0.13 ?F) would be averted. If one assumes that the warming is a factor of 4 larger because of positive feedbacks, as asserted by the Intergovernmental Panel on Climate Change (IPCC), the warming averted by a net zero U.S. policy would still be very small, 0.034 ?C (0.061 ?F). For worldwide net zero emissions by 2050 and the 4-times larger IPCC climate sensitivity, the averted warming would be 0.28 ?C (0.50 ?F). (continue reading)


Net Zero Averted Temperature Increase


Tags: Highlighted Article

Decarbonizing Buildings 2 - ORIGINAL CONTENT

The DOE Decarbonizing Buildings blueprint, while it deals with fossil fuel end use elimination in the buildings sector, is far more focused on limiting the electricity demand and consumption increases resulting from the replacement of oil and gas appliances and equipment and ICE vehicles with electric end use appliances, equipment and electric vehicles.

The logical first step in the decarbonizing process is improvements in the building envelopes to reduce energy demand and consumption. This step should be completed prior to the replacement of existing HVAC equipment with heat pumps to assure proper equipment sizing, since equipment oversizing reduces seasonal efficiency. Other appliance and equipment replacements can occur at any time, as their selection is unaffected by building envelope changes. However, installation of electric appliances and equipment might necessitate changes to the building electric wiring, power panel and service connection, which should also be addressed early in the process.

Once the building envelope improvements have been completed, the next logical step would be assessment of the building and its surroundings for the installation of solar collectors, which would reduce the building’s annual consumption of electricity from the grid and its peak electricity demand. There is also interest in the installation of local electricity storage, associated with on-site solar, which could further reduce building demand on peak and could potentially be drawn upon by the grid during periods of peak demand or low renewable generation. Installation of solar collectors, with or without on-site battery storage would also necessitate changes to the building electrical system.

The DOE blueprint assumes the adoption of electric vehicles, which would also necessitate changes in the building electrical system to provide for vehicle charging circuits but might also require power panel and service connection changes. The blueprint suggests the potential to draw upon the EV batteries during periods of peak grid demand or low renewable generation.

The blueprint contemplates a tripling of load shedding demand side management potential using smart meters and the Internet of Things (IoT) which could interrupt internet connected appliance and equipment operation to reduce demand on the grid. Resiliency to these service interruptions could be achieved through passive energy storage in the building and the use of larger volume storage water heaters. Laundry appliance use is relatively resilient. The least resilient appliances are probably ranges and ovens.

Smart meters make it possible to tailor rolling blackout coverage and duration. They also support development of “virtual powerplants”, which are groups of customers who agree to be interrupted, as needed, under specific sets of circumstances.

This suggests that DOE understands that grid expansion would be difficult and expensive and that a renewable powered grid would be less reliable than a grid powered by dispatchable generation.

There is no question that more efficient buildings could reduce energy consumption and demand. There is also no question that more efficient appliances and equipment could reduce energy consumption and demand. Lower power, 120 volt versions of current 240 volt appliances such as ranges, ovens, water heaters and laundry dryers would reduce demand, though at the cost of convenience. It might even be possible to use 120 volt heat pumps in apartment building conversions.

While the DOE roadmap calls for costly changes to buildings and equipment, there is little discussion regarding how these changes will be funded, with the exception that approximately 40% of government funding would be directed toward disadvantaged communities, which arguably represent the greatest need for investment and the least ability to pay.

We face a potential future of perpetual subsidies and incentives combined with mandated changes and banned products. This potential future does not include reduced energy costs or increased liberty and freedom.


Tags: Regulation, Net Zero Emissions, Energy Efficiency

How Much Warming Would Net Zero By 2050 Prevent? - Highlighted Article

  • 7/18/24 at 06:00 AM


From: Watts Up With That

By: Christopher Monckton of Brenchley

Date: June 13, 2024


How Much Warming Would Net Zero Prevent?


Some time ago, I sent Professor Richard Lindzen an estimate of how much warming a straight-line progress to net zero emissions by all nations on Earth would achieve. He was intrigued. Now – with the stellar team of Professors Happer and van Wiijngaarden – he has prepared a short paper, now published by our friends at the CO2 Coalition, that offers a scientific answer to that question:

https://co2coalition.org/publications/net-zero-averted-temperature-increase

By chance, on receiving news of the new paper, I was putting the finishing touches for a paper by my own team that covers the same subject matter. Our paper is intended for publication in an economics journal, where, like all papers presenting a serious and scientifically credible challenge to the official catastrophe narrative, it will probably be rejected out of hand, not because it is wrong but because it is right.

This article will briefly describe the two methodologies for answering the question “How much warming would net zero by 2050 prevent?”

Both approaches start by assuming that all nations (not just the West, against which the international climate accords are selectively targeted) move linearly together from their current emissions to net zero, achieving it by 2050.

First, here is the abstract from the professors’ paper –

Net Zero Averted Temperature Increase

Using feedback-free estimates of the warming by increased atmospheric carbon dioxide (CO2) and observed rates of increase, we estimate that if the United States (U.S.) eliminated net CO2 emissions by the year 2050, this would avert a warming of 0.0084 C (0.015 F), which is below our ability to accurately measure. If the entire world forced net zero CO2 emissions by the year 2050, a warming of only 0.070 C (0.13 F) would be averted. If one assumes that the warming is a factor of 4 larger because of positive feedbacks, as asserted by the Intergovernmental Panel on Climate Change (IPCC), the warming averted by a net zero U.S. policy would still be very small, 0.034 C (0.061 F). For worldwide net zero emissions by 2050 and the 4-times larger IPCC climate sensitivity, the averted warming would be 0.28 C (0.50 F). (continue reading)


How Much Warming Would Net Zero Prevent?


Tags: Highlighted Article

Decarbonizing Buildings - ORIGINAL CONTENT

The US Department of Energy (US DOE) has published Decarbonizing the U.S. Economy by 2050: A National Blueprint for the Buildings Sector, which contains a link to the full study. The document is long on words, thin on scoping and virtually devoid of plan. The “blueprint” identifies “cross-cutting goals” of equity, affordability and resilience.

The document lists the following strategic objectives:

  • Increase building energy efficiency - Reduce onsite energy use intensity in buildings 35% by 2035 and 50% by 2050 vs. 2005.
  • Accelerate onsite emissions reductions - Reduce onsite greenhouse gas emissions in buildings 25% by 2035 and 75% by 2050 vs. 2005.
  • Transform the grid edge - Reduce electrical infrastructure costs by tripling demand flexibility potential by 2050 vs 2020.
  • Minimize embedded life cycle emissions - Reduce embodied emissions from building materials and construction 90% by 2050 vs 2005.

“Federal actions to accelerate building decarbonization include: early-stage research and development that raises the ceiling on maximum technology performance and improves affordability; deployment and market stimulation activities that remove barriers to technology adoption and spur further market penetration of commercialized and emerging technologies; and efficiency standards and building codes that raise the floor of minimum performance and lock in proven cost-effective low-carbon technologies for mainstream adoption. Strategic coordination across these different types of actions increases their potential to accelerate deployment of high performance, low-carbon building solutions over time. “

The challenge of increasing building energy efficiency in the residential sector was addressed in detail 20 years ago by Building Green. They estimated the cost of a “major energy retrofit” at $50,000 per residential dwelling, though inflation in the building trades would have increased that cost to mere than $100,000 in 2024. The cost of retrofitting approximately 125,000,000 dwelling units would be approximately $12,500,000,000,000. The cost of retrofitting commercial buildings would add approximately $4,000,000,000,000. The payback period for these investments would be several decades.

Accelerating emissions reductions would be achieved by replacing primarily natural gas and propane end use equipment with electric end use equipment, including heat pumps for space heating and cooling, water heating and laundry drying and electric ranges and ovens. Normal equipment life cycle replacement could be assured by banning the sale of new fossil fuel appliances and equipment after some date certain. Replacement could be accelerated by employing a variety of incentives, subsidies and tax breaks, as is currently being done for electric vehicles and intermittent wind and solar generation.

The transformation of the grid edge would be accomplished through the application of remotely controllable smart meters and “The Internet of Things” to implement Demand Side Management of customer energy consumption to offset demand peak on the grid. This could potentially include drawing power from customer Powerwall and EV batteries.

Minimizing embedded cycle emissions “reduces the embodied emissions associated with new construction and major renovations, including material manufacturing, transport, construction, and disposal”.

Some types of buildings are expected to pose unique challenges.  A recent project to replace a fossil fuel heating system with heat pumps in a New York City Housing Authority complex cost $176,000 per unit in the 159 unit complex. The cost of a comprehensive major energy retrofit on the complex would have been substantially greater. The New York City Housing Authority manages more than 175,000 apartments in more than 1,000 buildings. Ongoing R&D on window-mounted heat pumps might help reduce the cost of future high rise apartment conversions.


Tags: Energy Efficiency, Net Zero Emissions, Regulation

The Price of Going Green Is High - Highlighted Article

  • 7/11/24 at 06:00 AM


From: IER

Date: June 7, 2024


The Price of Going Green Is High


Key Takeaways

  1. People around the world are beginning to object to the increasingly expensive costs of the “energy transition” being pushed by their governments and some businesses.
  2. A paper by the Climate Policy Initiative (CPI) advocates for much heftier expenses for consumers, by recommending a 7-fold increase in money spent on programs to achieve U.N. goals, reaching $9 trillion annually by 2030 and increasing after that.
  3. CPI is an international group with initial funding from George Soros that advocates for aggressive climate actions by central governments.
  4. Europe has already begun to de-industrialize, with Germany leading the way as they begin to retreat from some of their costliest plans under public pressure.
  5. States in the United States such as California, who have led in “green” initiatives, are also beginning to pushback on some “green” policies.

The Climate Policy Initiative (CPI) indicates that climate finance worldwide must increase from $1.3 trillion in 2021/2022 to $9 trillion by 2030 to keep the goals of the Paris Agreement alive. The CPI is an international organization launched with initial funding from George Soros, with offices in the United States, China and other countries. It finds that the annual climate finance needed immediately increases to $8.1 trillion and then steadily increases to $9 trillion by 2030, jumping to over $10 trillion each year from 2031 to 2050. Where is that kind of money going to come from? Countries raised a record $104 billion last year by charging firms for emitting carbon dioxide through carbon pricing and cap and trade systems, but that is a drop in the bucket to what CPI stipulates is needed. Thus, taxes and fees must rise enormously at a time three-quarters of energy consumers say they have already done as much as they can to be sustainable, according to a survey of 100,000 people over 20 countries by the research arm of accounting firm Ernst & Young.

In 2021/2022, average annual climate finance flows reached almost $1.3 trillion, doubling compared to 2019/2020 level of $653 billion driven primarily by a significant acceleration in mitigation finance, particularly in the renewable energy and transport sectors. Mitigation finance was increased by $439 billion from 2019/2020 levels. Despite the increase, current financial flows represent only about one percent of global GDP.  And, those financial flows are already taking a toll on home owners, businesses and consumers via skyrocketing energy costs which flow through the cost of all human endeavors, including agriculture and transportation. (continue reading)


The Price of Going Green Is High


Tags: Highlighted Article

Great Green Challenges - ORIGINAL CONTENT

Many in the climate change alarmist community view green Hydrogen as the Great Green Hope. The previous commentary, Great Green Hope, dealt with the steps necessary to produce green Hydrogen and their current costs. However, that is only part of the process.

Green Hydrogen has multiple potential applications in a Net Zero energy economy. Massive storage in underground caverns could serve as long-duration backup for intermittent renewable generation, used as fuel for Hydrogen fuel cells or combined-cycle and simple-cycle gas turbines. Preparation of these caverns would require testing to determine their volume and safe working pressure, evacuation to remove the air from the caverns and filling the caverns with Hydrogen to the safe working pressure. A portion of the Hydrogen stored in the caverns would remain as “cushion gas”, providing the pressure required to feed gas to the electric generators.

Green Hydrogen could be used as motor fuel for vehicles of all types, including railroad locomotives. This application would require the Hydrogen to be compressed to 5,000 – 10,000 psi and stored in fueling cascades at vehicle fueling stations. The Hydrogen could be delivered to the fueling stations by pipeline and compressed on-site, or as a cryogenic liquid regasified and compressed on-site, or as compressed gas delivered by rail or truck, depending on fueling station access.

Green Hydrogen could also be used as fuel for combustion appliances, such as furnaces, boilers, water heaters, range tops and ovens in residential and commercial structures. This application would require either pipeline delivery or on-site pressurized storage. This application would also require Hydrogen dedicated appliances or refitting of individual appliances to burn Hydrogen safely.

Finally, there are multiple potential applications for green Hydrogen in industrial applications, both as a combustion fuel and as a chemical feedstock. These applications would typically require pipeline delivery.

Hydrogen is currently used as vehicle fuel, on a very limited basis, and as a chemical feedstock. Most of this Hydrogen is “Blue Hydrogen”, produced by steam reforming of natural gas. Blue Hydrogen is relatively inexpensive, but its production results in CO2 emissions, which means it is not suitable for large scale application in a Net Zero energy economy.

Hydrogen is currently delivered by pipeline, or by truck as either a cryogenic liquid or a compressed gas. However, the delivery infrastructure is very limited relative to the infrastructure which would be required to replace natural gas with Hydrogen in a broad range of applications in a Net Zero energy economy. There is a possibility that the existing natural gas transmission and distribution system could be upgraded and adapted to Hydrogen delivery. However, the required technology has not been identified and demonstrated.

There is also the possibility that a Green Hydrogen trade could be developed to replace the current trade in liquified natural gas. Liquid Hydrogen ships could be fueled with boil-off from the cargo, as is the case with LNG tankers. Liquid hydrogen could also be used to fuel other types of ships, again using boil-off from an onboard cryogenic fuel storage vessel.


Tags: Hydrogen, Green Energy Transition, Energy Storage / Batteries

Call that science? - Highlighted Article

  • 7/4/24 at 06:00 AM


From: Climate Discussion Nexus

By: OP ED Watch

Date: June 5, 2024


Call that science?


A correspondent recently sent us a poster “A Rough Guide to Spotting Bad Science” that we found very interesting because it wasn’t about climate change. When one is engaged in controversy there is a persistent temptation to “cast a covetous eye on the outcome”, in Kierkegaard’s apt and haunting phrase. It is easy to start choosing data and prejudging lines of argument based on whether they seem likely to take us where we want to go. Or rather where we want to go in the heat of the moment. Surely on calm reflection all of us want to go where the truth lies, even if getting there requires us to admit we had been mistaken in some regard. So this post, from a site called “Compound Interest” in 2014, is useful in helping us all pause and reflect calmly. The 12 items listed by Andy Brunning, who runs the site, are “1. Sensationalized headlines 2. Misinterpreted results 3. Conflicts of interest 4. Correlation and causation 5. Unsupported conclusions 6. Problems with sample size 7. Unrepresentative samples used 8. No control group used 9. No blind testing used 10. Selective reporting of data 11. Unreplicable results 12. Non-peer reviewed material”. And note that we present them even though #12 strikes us as itself bad science, given the extraordinary flood of evidence lately that peer review is deeply, even fatally flawed, and because climate alarmists are or were very fond of insisting that it was a silver bullet. As for the rest, well, they seem to us to be very important errors and very common, including among alarmists.

Easy to call, hard to run, we say echoing Oakland Raiders quarterback Kenny “Snake” Stabler. Of course there is no silver bullet in making sense of the world, here or anywhere. And when it comes to items like “Unsupported conclusions” there’s a major risk of an exchange of “I know you are but what am I?” taunts. But we still want to run through the list in order and underline how often they seem to us to crop up on the other side of the climate barricade. And we intend to return to them in future Newsletters to continue the discussion.

Naturally alarmists may say the same of us and we’re happy to debate it. But first let’s think about whether these really are good ground rules. We think they are, other than the last, so let us know if you don’t. And if you do, here’s our summary indictment of the sins against science by those promoting an urgent man-made climate crisis, some of them scientists and others second-hand dealers in scientific ideas.

For starters, how about sensationalized headlines? Oh yeah. They’re a dime a dozen in climate, including such gems as “‘Doomsday glacier,’ which could raise sea level by several feet, is holding on ‘by its fingernails,’ scientists say”. Glaciers got fingernails? Every week brings a crop of them, mostly flawed in ways that fall under subsequent headings here but many also because they predict things that don’t happen.

Misinterpreted results? Look at the stuff on catastrophic sea level rise just for starters. And the way most of these shrieking headlines vastly overstate even what’s in the news story, let alone the study the story is based on.

Conflicts of interest? Alarmists are quick to smear skeptics as in the pay of oil companies. But the real gravy train is tidal waves of government funding for research that confirms the orthodox narrative and almost exclusively that kind. It doesn’t prove they’re wrong, of course, or even that they’re venal. But it is a massive issue and one that they do not disclose or discuss. (continue reading)


Call that science?


Tags: Highlighted Article
Search Older Blog Posts