Call or complete the form to contact us for details and to book directly with us
435-425-3414
435-691-4384
888-854-5871 (Toll-free USA)


Contact Owner

*Name
*Email
Phone
Comment
 
Skip to Primary Navigation Skip to Primary Content Skip to Footer Navigation
▽ Explore More ▽ Hide

Climate and Climate Change

Climate and Climate Change

Climate Change

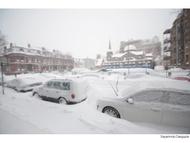
Two days before Halloween, 2011, New England was struck by a freak winter storm. Heavy snow descended onto trees covered with leaves.  Overloaded branches fell on power lines.  Blue flashes of light in the sky indicated exploding transformers.  Electricity was out for days in some areas and for weeks in others. Damage to property and disruption of lives was widespread.

That disastrous restriction on human energy supplies was produced by Nature.  However, current and future energy curtailments are being forced on the populace by Federal policies in the name of dangerous “climate change/global warming”.  Yet, despite the contradictions between what people are being told and what people have seen and can see about the weather and about the climate, they continue to be effectively steered away from the knowledge of such contradictions to focus on the claimed disaster effects of  “climate change/global warming” (AGW, “Anthropogenic Global Warming”). 

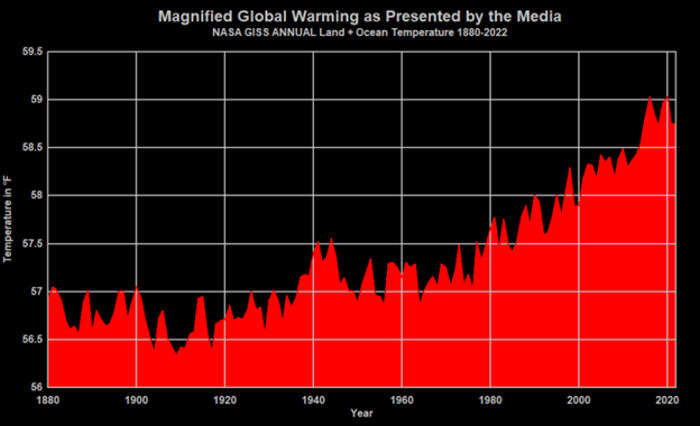
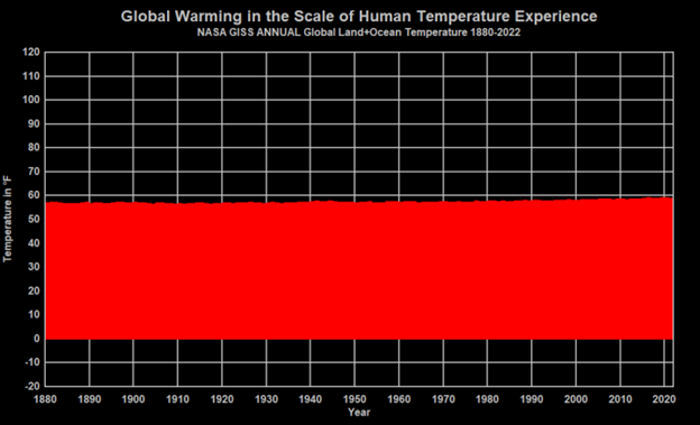
People are seldom told HOW MUCH is the increase of temperatures or that there has been no increase in globally averaged temperature for over 18 years.  They are seldom told how miniscule is that increase compared to swings in daily temperatures. They are seldom told about the dangerous effects of government policies on their supply of “base load” energy — the uninterrupted energy that citizens depend on 24/7 — or about the consequences of forced curtailment of industry-wide energy production with its hindrance of production of their and their family’s food, shelter, and clothing. People are, in essence, kept mostly ignorant about the OTHER SIDE of the AGW debate.

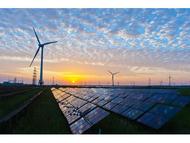
Major scientific organizations — once devoted to the consistent pursuit of understanding the natural world — have compromised their integrity and diverted membership dues in support of some administrators’ AGW agenda.   Schools throughout the United States continue to engage in relentless AGW indoctrination of  students, from kindergarten through university.  Governments worldwide have been appropriating vast sums for “scientific” research, attempting to convince the populace that the use of fossil fuels must be severely curtailed to “save the planet.”  Prominent businesses — in league with various politicians who pour ever more citizen earnings into schemes such as ethanol in gasoline, solar panels, and wind turbines — continue to tilt against imaginary threats of AGW.  And even religious leaders and organizations have joined in to proclaim such threats.   As a consequence, AGW propaganda is proving to be an extraordinary vehicle for the exponential expansion of government power over the lives of its citizens. 

Reasoning is hindered by minds frequently in a state of alarm.  The object of this website is an attempt to promote a reasoned approach; to let people know of issues pertaining to the other side of the AGW issue and the ways in which it conflicts with the widespread side of AGW alarm (AGWA, for short).  In that way it is hoped that all members of society can make informed decisions.

Fauci, Fear, Balance and the Grid - Highlighted Article

  • 5/25/23 at 07:00 AM


From: Climate Etc.

By: Russ Schussler

Date: May 8, 2023


Fauci, Fear, Balance and the Grid


Reflecting on the U.S. response to the covid pandemic, Dr. Fauci provides some important insights on managing complex risks – with relevance to climate change and the electric grid transition.

Dr. Fauci discussing past covid measures was recently quoted as saying,

“(W)e looked at it from a purely public-health standpoint. It was for other people to make broader assessments—people whose positions include but aren’t exclusively about public health. Those people have to make the decisions about the balance between the potential negative consequences of something versus the benefits of something.”

I was surprised to hear that Dr. Fauci did not think that public health should have been in total control of the pandemic response.  But he is right. We needed diverse experts providing input and impacting policy choices – some who worry about public health, others who worry about individual health, others who worry about children, and others well versed on the economic impacts of it all.  Doing everything possible to stop the spread of covid, all other costs and consideration be damned, should have been expected to reduce the overall well-being of society and provide grossly suboptimal outcomes.  Focusing solely on covid risks was likely counterproductive even for those most at risk from covid.

In the U.S., the balanced path Dr. Fauci is now advocating was not seriously pursued during the pandemic. With the Covid panic, it seemed public health took over with one over-riding goal.  Advocates for individual health and individual health care found few available forums and inroads to appeal to and  impact policy makers. Appearing to be against the central narrative of those in power may have had severe consequences for individuals and organizations. In hindsight, many see that balancing competing views and values would have better served us all. In focusing so exclusively on the threat of covid, we increased our risk from so many other threats.  Many now understand that our “best” scientific understandings should be subject to challenges.  It certainly seems we needed “other people” to speak up, but those voices did not find the platforms they would need to influence policy and direction. (continue reading)


Fauci, Fear, Balance and the Grid


Tags: Highlighted Article

What if ...? - ORIGINAL CONTENT

The consensed climate science community has created a narrative that anthropogenic emissions of CO2, CH4 and N2O are causing additional heat to be retained in the earth’s atmosphere, that this additional heat is increasing the global average temperature, that this increased temperature is changing earth’s climate, that this change in climate is undesirable, and that these anthropogenic emissions must be drastically reduced or eliminated to avoid pushing the planet through a ‘tipping point” from which it cannot recover. The narrative asserts that the climate changes are affecting the frequency and intensity of extreme weather events, including hurricanes, tornadoes, floods, droughts and even wildfires.

But what if the consensus narrative is in error in one or more of a variety of ways?


Climate Science

What if…

  • CO2 is not the climate “control knob”?
  • natural variation is contributing to recent warming?
  • land use changes are contributing to recent warming?
  • the Urban Heat Island effect has increased measured temperature anomalies?
  • “adjustments” to measured temperatures have increased reported anomalies?
  • climate models do not accurately model the climate?
  • climate models were hindcast against inaccurate temperature anomalies?
  • attribution models don’t model extreme weather events accurately?
  • the CO2 effect in the atmosphere is essentially saturated?
  • the additional CO2 in the atmosphere is causing beneficial global greening?
  • the additional CO2 in the atmosphere is increasing food crop production?


Climate Policy

What if…

  • recent climate change does not constitute a “crisis” or “existential threat”?
  • the current Social Cost of Carbon is negative?
  • Net Zero GHG emissions are not necessary?
  • driving the fossil fuel industries out of business is unnecessary?
  • intermittent renewable generation increases electric energy costs?
  • electricity storage increases electric energy costs?
  • long-duration electric storage capacity is unavailable?
  • renewable capacity additions lag conventional capacity reductions?
  • “all-electric everything” is unnecessary or undesirable?
  • electric vehicle utility remains limited?
  • renewable capacity additions lag “all-electric everything” expansion?
  • renewable intermittency adversely affects grid stability?
  • renewable intermittency adversely affects grid reliability?
  • there are no replacements for some products made from fossil fuels?
  • there are no replacements for some fossil-fueled processes?


Net Zero by 2050 is clearly Goal “A” for the OECD (Organisation for Economic Co-operation and Development) countries, though just as clearly not for the developing nations. However, there appears to be no clear and comprehensive Plan “A” for achieving Goal “A”. There also appears to be no Plan “B” in the event that Goal “A” is unachievable or unnecessary, or the unidentified elements of Plan “A” fail to come together timely.

The ”What if” questions above are not new, but there has been great reluctance on the part of the consensed climate science community, their political allies and the main stream media to attempt to seriously address and resolve these issues. However, electricity prices are increasing, largely as the result of duplication of generating facilities. Grid reliability and resiliency is also being questioned by the Federal Energy Regulatory Commission (FERC), the North American Electric Reliability Corporation, Independent System Operators (ISOs) and Regional Transmission Organizations (RTOs) which are responsible for regulation and operation of the electric utility grid.


Tags: Climate Consensus, Climate Predictions, Climate Policy

Silence of the Grid Experts - Highlighted Article

  • 5/18/23 at 07:00 AM


From: Climate Etc.

By: Russ Schussler

Date: May 3, 2023


Silence of the Grid Experts


There are many reasons why grid experts within the electric utility industry have not spoken out when unrealistic “green” goals were being developed and promoted over the last 20 years or so. A more open debate during this period might have helped provide a  more realistic foundation for future development.  This posting describes some reasons as to why at the corporate level electric utilities did not speak out more in defense of grid reliability.  Collectively these factors tended to eliminate grid experts from playing any role in the development of policies impacting the grid.


Speaking Out Risked Negative Consequences

Utilities have many stakeholders with varying degrees of power.  Utilities depend on good relations with Public Service Commissions, other regulators, consumers and policy makers. The stereotype of electric utilities as uncaring, selfish, greedy destroyers of the environment tends to make utilities very cautious and careful in critiquing anything perceived as “green”.  The media and press attention from any such statements would likely not be favorable.

Utilities need support to acquire right-of-way, for financing, for cost-recovery and to avoid adverse legislation. Poor press and the associated public disapproval loomed as strong disincentives for speaking out.  Furthermore, as will be discussed later, expressing concerns over emerging reliability issues, could be interpreted by some as implying that perhaps you were not as capable as others appear to be. (continue reading)


Silence of the Grid Experts


Tags: Highlighted Article

Climate & Fairy Tales - ORIGINAL CONTENT

Discussions of climate and climate change frequently call to mind several children’s fairy tales and the story of a fairy tale kingdom. This suggests a lack of seriousness in these discussions, though the participants frequently view them as deadly serious.

The first fairy tale that comes to mind is Goldilocks and the Three Bears, in which Goldilocks discovers things in the bears’ dwelling which are “just right”. In climate science, there is discussion of the Goldilocks Principle, which holds that “something must fall within certain margins, as opposed to reaching extremes.” Some discussions regarding climate revolve around the idea that the earth’s climate experienced a Goldilocks period during which “everything was just right”. This period is generally thought to have been after the end of the Little Ice Age and before human activities began to affect the climate. Of course, the earth has numerous regional climates, and it is not likely that all those regional climates were “just right” from the perception of those living in them.

This brings us to a discussion of the fairy tale kingdom of Camelot where, according to the Lerner and Lowe song, “The climate must be perfect all the year”. Some climate discussions advance the position that earth’s climate was “perfect” during some Goldilocks period and that climate should not change from those “perfect” conditions. Some hold that the climate was unchanging for some long period of time (the shaft of a hockey stick) and then began to change rapidly and undesirably (the blade of the hockey stick) as the result of human activities. They hold that the climate should be unchanging and should be returned to the conditions of the Goldilocks period. Those holding that position might be referred to as “climate change defialists’, of simply “climate defialists”.

Climate alarmists appear to have forgotten the lessons of two cautionary fairy tales, Chicken Little and The Boy Who Cried Wolf. Chicken Little was intended to show “the evils of mass hysteria”. Alarmists have resorted to expressions such as “earth on fire” and “the oceans are boiling” and predictions of mass migration of climate change refugees as the result of rising sea levels and near-surface temperatures in an attempt to incite public concern and pressure to stop climate change. While they have succeeded in creating hysterical reactions in some groups, they have been largely unsuccessful in inciting mass hysteria in the general population.

The Boy Who Cried Wolf, on the other hand, warned of the loss of credibility after numerous false claims of danger when the real danger arose. Climate alarmists have made numerous claims of danger from worsening adverse weather events, such as tropical cyclones, heat waves, drought, floods, sea level rise and ocean “acidification”. These claims are frequently not taken seriously because the weather and climate data do not support them and these weather events are not new phenomena.

The final fairy tale which comes to mind is The Emperor’s New Clothes, the story of two swindlers who approach the emperor and “offer to supply him with magnificent clothes that are invisible to those who are stupid or incompetent”. This fairy tale evinces thoughts of magnificent new energy technologies which are reliable and cheap, but cannot be appreciated by those who are “stupid or incompetent”, such as “climate deniers”.


Tags: Climate Alarmists

Renewable Experts: Undeterred and Unmoved by Failed Ideas - Highlighted Article

  • 5/11/23 at 07:00 AM


From: Climate Etc.

By: Russ Schussler

Date: April 17, 2023


Renewable Experts: Undeterred and Unmoved by Failed Ideas


“Green” ideas and their proponents can create problems.  Like the antagonist in Terminator 2, green arguments and proponents don’t go down easily.  With serious challenges, they retreat, hibernate sometimes, morph, transform and come back.  It’s hard to argue with many “green” energy ideas.  They are often huge in scope but severely limited in details.  Focusing on a couple key factors and ignoring  or leaving so much to be worked out later.  Painfully naïve or unaware of so many factors associated with the provision of energy, feedback and often even human behavior.   They see the flaws in current efforts, but are blind to the drawbacks which will necessarily emerge from their proposals.  The offer conjectures with a lot of dots to still be connected. They speak of things that may be possible, without any handle on the probabilities.


Usually, “green” ideas are packaged with threats of doom, promises of superior technology or both.   The media are drawn to both those themes and many policy makers are attracted as well.   Attention is a great thing for new ideas.  The themes of urgency and the scope of change,  gives these ideas more weight and seeming gravitas.  Unfortunately, the needed incentives to dig down and look critically as these ideas are generally lacking. Woefully, those promulgating “green” ideas don’t have much incentive for engaging with their critics or broadening their understandings. They generate the feeling that we need to move forward with the big, new important thing – no time for distractions. (continue reading)


Renewable Experts: Undeterred and Unmoved by Failed Ideas


Tags: Highlighted Article

Paths to Net Zero - ORIGINAL CONTENT

Numerous potential paths to net zero annual CO2 emissions have been identified and discussed, including:

  • Renewables plus storage
  • Massively overbuilt renewables and transmission
  • Renewables plus Dispatchable Emission-Free Resources (DEFR)

Each of these paths faces massive technological hurdles.

The renewables plus storage path requires short, medium and long duration storage. Short duration storage (~4 hours) is available with lithium batteries, but at very high cost. Medium duration storage (~8-16 hours) is under development, but is not yet commercially available and its cost is unknown. Long duration storage (weeks) is currently available only with pumped hydro, but its availability is very limited and there has been strong resistance to expanding it.

The cost and availability issues with storage have led some to propose a path based on massive overbuilding of renewable generation combined with massive additional transmission capacity. This approach assumes that there would always be excess renewable electricity available somewhere which could be moved to areas with inadequate renewable generation output resulting from adverse weather conditions or equipment failure. Ultimately, this approach would require development of a massively interconnected national grid with the ability to move power multi-directionally over far longer distances than is common today.

The renewables plus DEFR path relies on the availability of generation technology which is as yet undefined, no less developed and commercialized. There is no indication of when this technology would become available, not is there any information regarding its cost.

The US Administration is currently focused on renewables and has only recently placed any focus on storage. The Administration’s approach combines incentives for renewable generation, storage and transmission infrastructure with mandates to terminate operation of fossil-fueled generation. The Administration has also taken steps to progressively deprive the market of access to oil and natural gas, causing their prices to increase. The Administration also provides incentives for electric vehicles, combined with a ban on new fossil-fueled vehicle sales after 2035. There are also incentives for purchase of electric appliances and equipment, which are made more attractive by the increasing prices of oil and natural gas resulting from the Administration’s actions.

The Administration approach involves substantial risks, created primarily by the hard deadlines for elimination of coal generation (2030) and natural gas generation (2035). There is no assurance that sufficient renewable generation, electricity storage and transmission infrastructure will be operational by these hard deadlines to replace this dispatchable capacity, as well as to provide the additional capacity required to meet normal market growth and the approximate tripling of current demand by 2050 resulting from electrification of current fossil fueled end uses.

The Administration, while it has not carefully planned this transition to all-renewable “all-electric everything”, has carefully positioned itself to blame any failure to achieve its goals, as well as electricity price increases and loss of grid reliability on others, since it has established timelines and provided generous incentives.

There has not yet been a comprehensive demonstration of an energy system such as the Administration demands, though there have been several notable failures of partially implemented systems in Germany, UK, California and Texas.

Don’t begin vast programs with half-vast ideas.


Tags: Electric Power Generation, Electric Power Dispatchable, Energy Storage / Batteries

The State of the Climate 2022 - Highlighted Article

  • 5/4/23 at 07:00 AM


From: The Global Warming Policy Foundation (GWPF)

By: Ole Humlum

Date: April 2023


The State of the Climate 2022


General summary

This report has its focus on observations, and not on output from numerical models, with a few exceptions (e.g. Figure 38). References and data sources are listed at the end of the report.

Air temperatures

Average air temperatures measured near the planet’s surface (surface air temperatures), or rather their deviation from the average calculated for a chosen reference period, are central to many climate deliberations. However, the significance of any short-term warming or cooling recorded in these datasets should not be overstated. Firstly, focusing on averages tends to hide the fact that we all deal with much larger temperature variations on a daily basis. Secondly, whenever Earth experiences warm El Niño or cold La Niña episodes, major heat exchanges take place between the Pacific Ocean and the atmosphere above, eventually showing up as a signal in the global air temperature. However, these do not reflect similar changes in the total heat content of the atmosphere-ocean system. In fact, the global net changes involved may be small; such heat exchanges may chiefly reflect redistribution of energy between ocean and atmosphere. Evaluating the dynamics of ocean temperatures is therefore equally as important as evaluating changes in surface air temperatures.

Relative to the whole period since 1850/1880, 2022 was warm, but cooler than most years since 2016. A moderate La Niña episode played out during the year, underlining the importance of ocean-atmosphere exchanges.

Many Arctic regions experienced record high air temperatures in 2016, but since then, including in 2022, conditions generally have turned somewhat cooler. The Arctic temperature peak in 2016 may have been affected by ocean heat, released from the Pacific Ocean during the strong 2015–16 El Niño and subsequently transported towards the Arctic. This underscores how Arctic air temperatures may be affected, not only by variations in local conditions, but also by variations playing out in geographically remote regions.

Many diagrams in this report focus on the time from 1979 onwards, reflecting the start of the satellite era, and the advent of a wide range of observations with nearly global coverage, including temperature. These data give a detailed view of temperature changes over time at different altitudes in the atmosphere. Among other phenomena, they reveal that a Stratospheric temperature plateau has prevailed since 1995.

Since 1979, temperatures in the lower Troposphere have increased over both land and oceans, but most clearly over land. The most straightforward explanation for this observation is that much of the warming is caused by solar insolation, but there may well be several supplementary reasons, such as differences in heat capacity and changes in cloud cover and land use.

Oceans

The Argo program has now achieved 19 years of global coverage, growing from a relatively sparse array of 1000 profiling floats in 2004, to more than 3900 in December 2021. Since their inception, these have provided a unique ocean temperature dataset for depths down to 1900 m. The data is currently updated to August 2020. Although the oceans are much deeper than 1900 m, and the dataset is still relatively short, interesting features are now emerging from these observations. (continue reading)


The State of the Climate 2022


Tags: Highlighted Article

Capacity Factors - ORIGINAL CONTENT


The US Department of Energy, Energy Information Administration chart below is arguably accurate but inarguably misleading.


Capacity Factor by Energy Source in 2020


The capacity factors shown for both wind and solar, while they are the actual percentage of rating plate capacity delivered to the grid in 2020, are also approximately equal to the limiting capacity factors of the generators as installed, since the output of both wind and solar generation have priority access to the grid.

The nuclear generation capacity factor shown above is the rating plate capacity of the nuclear generators less an allowance for downtime for maintenance and refueling. Otherwise, nuclear generators typically operate base loaded at rating plate capacity because of their low operating costs.

Geothermal generation provides a constant source of energy as required and is typically dispatched when available, with a downtime allowance of approximately 25% for maintenance and repair.

Hydroelectric generation capacity factor is largely dependent on water availability behind the dams as well as water demand downstream of the dams. A portion of the hydroelectric generation capacity is reliable, while the remainder is “source of opportunity” capacity based on water availability.

Coal and natural gas generators are typically operated in load-following mode, providing the difference between renewable and nuclear generation output and grid demand. They also typically represent the utilities’ capacity reserve margin on peak, available in the event of a failure of the utilities’ largest single generation resource. The capacity factors shown in the chart above are the actual percentage of rating plate capacity delivered to the grid in 2020. However, those generators have real capacity factors of approximately 85% for coal generation and 90% for natural gas combined cycle generation.

Of the generation sources shown in the graphic, only wind and solar are not dispatchable. Their availability is dependent upon wind and sun conditions. When they are available, they displace the output of dispatchable generators. However, the capacity of the dispatchable generators must still remain available to meet grid demand during periods of low/no wind and solar availability.

As the fraction of wind and solar generation increases, the percentage utilization of the generating capacity of coal and natural gas generators would decline, to the extent the decline is not offset by increasing grid demand or the permanent closure of these generators as a function of age, operating cost or government edict. Grid demand is expected to increase at a more rapid pace, driven by the Administration’s focus on “all-electric everything”, which would ultimately approximately triple grid demand by 2050.

The assumption is that increasing grid demand would be served by increased wind and solar generation. However, the intermittency of these generators means they would continue to require support during periods of low/no wind and solar availability. This support is now provided primarily by dispatchable fossil-fueled generators, but might also be provided by electricity storage capacity in the form of batteries or pumped storage. These storage resources would have to be in place and operating before the scheduled closure of the remaining coal generating capacity in 2030 and the remaining natural gas generating capacity by 2035.


Tags: Electric Power Generation

Energy Security is National Security - Highlighted Article

  • 4/27/23 at 07:00 AM


From: Institute for Energy Research

By: Thomas Whackman

Date: April 2023


Energy Security is National Security


Introduction

Energy security is national security. One cannot exist without the other, and a lack of either can have serious ramifications. For evidence of this, look no further than Europe, where Germany is reeling from the twin blows of ill-conceived domestic energy policies and wholesale energy dependence on its chief geopolitical adversary: Russia.

The German case is but one example of the many pitfalls a nation faces when it fails to secure its energy supply. American policymakers would do well to take this cautionary tale to heart – and soon – as the Biden administration’s plans to force a complete energy transition away from fossil fuels may lead America down the long and painful road of energy dependency.

Due in large part to government intervention, the United States is becoming progressively more reliant on electric vehicles (EVs) and nonnuclear renewable energy sources for its transportation and energy needs. These technologies rely on a large input of rare earth metals and other mined elements, particularly lithium and cobalt, the supply of which is dominated almost entirely by the People’s Republic of China (PRC). These same minerals are also key inputs in the production of many advanced weapons systems, like fighter jets and ballistic missile defenses, that are critical for a robust national defense.

This, along with the current administration’s ongoing war against domestic hydrocarbon production, puts America’s energy security, and its national security, in real jeopardy. It is therefore incumbent to unpack just what energy security means, its relationship to national security, what that means for the United States, and the consequences that can occur when leaders attempt to ignore the fundamental physical realities that create the context in which statecraft resides. (continue reading)


Energy Security is National Security


Tags: Highlighted Article

Consensus & Science - ORIGINAL CONTENT

Consensus: general agreement, the judgement arrived at by most of those concerned, group solidarity in sentiment and belief (Source: Merriam-Webster)

Science: knowledge or a system of knowledge covering general truths or the operation of general laws especially as obtained and tested through scientific method, such knowledge or such a system of knowledge concerned with the physical world and its phenomena, the state of knowing : knowledge as distinguished from ignorance or misunderstanding (Source: Merriam-Webster)

One of the most frequently cited memes regarding climate science is that: “97% of climate experts agree humans are causing global warming.“ This meme originated with skepticalscience.com, but has been repeated in slightly different form by several other sources. Some have even suggested that humans are totally responsible for global warming. This meme clearly meets the definitions of consensus, though it also meets some aspects of science.

Global warming has certainly been occurring since the late 1800s, as measured by near-surface temperature measurements and satellite observations (since 1979), as well as indicated by a variety of paleoclimatic proxies. The paleoclimatic proxies indicate that both global warming and global cooling have occurred numerous times during the past ~4500 years, as shown in the graph below.


Global Temperatures (2500 BC - 2040 AD)


The potential for human influence on climate was hardly considered until the 20th century. The various warming and cooling cycles shown in the graph above, prior to the end of the Little Ice Age (LIA), are assumed to be the results of natural climate variations. However, the “scientific consensus” is that humans are causing the global warming since the end of the LIA, and especially since the middle of the 20th century, at least in part. However, there is no scientific evidence that natural variation in the earth’s climate has ceased or even substantially diminished.

There is scientific evidence that certain human activities can influence warming and cooling of the climate, including emissions of so called greenhouse gases (GHGs), emissions of aerosols and land use changes which affect the earth’s albedo. The magnitude of these human activities can be measured with reasonable accuracy, but the effects of these human activities on global temperatures can only be estimated.

There is a less pervasive consensus that CO2 emissions are the primary driver of the recent warming, although there is no scientific proof that is the case. Those who are part of that consensus believe that human CO2 emissions must be radically reduced or eliminated to avoid runaway future warming or some undefined “tipping point” leading to a climate crisis. This has led to a limited but vocal political consensus that global CO2 emissions must be reduced to Net Zero by 2050. This political consensus is not supported by the science, or by the governments of many developing nations.

The Intergovernmental Panel on Climate change (IPCC) has developed a consensus estimated range of the sensitivity of global warming to atmospheric CO2 concentrations, although it has recently acknowledged that the higher end of the range of sensitivity estimates is less likely to be correct. The IPCC ensemble of climate models projects a broad range of possible future global temperature trajectories, though there is no consensus regarding which, if any, of those models is accurate.

With regard to global warming, the consensus appears to be stronger than the science.


Tags: Temperature Record, Global Temperature, Climate Consensus, Climate Science

The New Pause lengthens to 8 years 9 months - Highlighted Article

  • 4/20/23 at 07:00 AM


From: Watts Up With That

By: Christopher Monckton of Brenchley

Date: April 3, 2023


The New Pause lengthens to 8 years 9 months


The New Pause has lengthened to 8 years 9 months. The least-squares linear-regression trend on the UAH monthly satellite global-temperature dataset shows no global warming from July 2015 to March 2023. As usual, this site is just about the only place where this continuing failure of global temperatures to do as they are told is reported.


The start and end dates of the New Pause are not cherry-picked. The end date is the present; the start date is the farthest back one can reach and still find a zero trend. It is what it is.

For comparison, here is the entire dataset for 44 years 4 months since December 1978. It shows a less than terrifying long-run warming rate equivalent to 1.3 degrees/century, of which 0.3 K has already occurred since January 2021, leaving just 1 K to go (on the current trend) until 2100, by which time reserves of coal, oil and gas will be largely exhausted. (continue reading)


The New Pause lengthens to 8 years 9 months


Tags: Highlighted Article

Anomalous Anomalies - ORIGINAL CONTENT

anomalous: inconsistent with or deviating from what is usual, normal, or expected

anomalies: deviations from the common rule

Global warming is monitored by estimating successive global average temperature anomalies  (“deviations from the common rule”) from the global average temperature over a historical climatology period. The temperature anomalies calculated by various government and non-government agencies are not directly comparable because the agencies use different climatology reference periods. However, there is general agreement that the global climate has warmed by 1.0+/- 0.2°C over the most recent century. The graph below is a typical presentation of global average temperature increase over time.


Global Mean Temperature over Land & Ocean


Note that the “Y” axis of the graph is truncated to a range of 2°C rather than the full range of temperatures experienced over the earth over the base time period, which range from -89.2°C (-128.6°F) to 56.7°C (134.1°F).

I have previously used Wichita, Kansas to provide an anomalous perspective on global warming (here), (here) and (here). Wichita, Kansas is located very close to the geographic center of the contiguous United States. The annual average temperature in Wichita is approximately 57°F (13.9°C), which is also the current global average near-surface temperature.

The graph below originated on the Powerline blog and has been modified here with the addition of the red and blue bands representing the average diurnal temperature ranges for the peak summer month (July, red) and peak winter month (January, blue) in Wichita. This allows comparison of the global average annual temperature change over the period from 1880 through 2015 (~1.6°F), the orange line on the graph, with the average diurnal and peak seasonal temperature changes in Wichita. (Note that the chart temperature range is from -10°F to +110°F, slightly lower than the -22°F to +114°F record temperature range for Wichita over the same period.)


Average Annual Global Temperature 1880-2015


The local temperature anomaly in Wichita has ranged from approximately +57°F (+31.6°C) to approximately -79°F (-43.8°C) over the base period from 1880 to present. The local diurnal temperature anomaly in Wichita is approximately 20°F (11.1°C), as shown above, for both the peak summer month (July) and the peak winter month (January). The local peak seasonal average temperature anomaly is approximately 50°F (27.7°C).

This graph puts the global annual average temperature anomaly in a very different perspective from the NOAA graph which preceded it. The global annual temperature anomaly over the 140+ year base period is slightly more than 1% of the local peak temperature anomaly in Wichita over the period.

The graph below shows the satellite temperature record for the period 1979- January 2023, relative to the 30-year climatology period 1991-2020, reported by Dr. Roy Spencer of the University of Alabama Huntsville. UAH reports warming of +0.13°C per decade, or approximately 0.57°C since 1979. However, the monthly temperature anomalies over the period have ranged from approximately -0.68°C to +0.70°C, or more than twice the average anomaly.


UAH Satellite-Based Temperature of the Global Lower Atmosphere - January 2023


The monthly satellite lower troposphere temperature anomaly for the contiguous United States varied from +0.88°C to – 0.51°C over calendar year 2022, a range of 1.39°C, or approximately 1.7 times the global annual average temperature anomaly over the 140+ year base period shown in the NOAA graph above.
Against this background, a cumulative temperature anomaly of 1.0 +/- 0.2°C over a 140+ year period does not seem particularly significant, nor does a projected future anomaly increase of 0.5°C-1.0°C.


Tags: Temperature Anomaly, Temperature Record

The contradictory Green policies to limit CO2 emissions - Highlighted Article

  • 4/13/23 at 07:00 AM

From: edmhdotme

Date: April 4, 2023


The contradictory Green policies to limit CO2 emissions


Summary

Currently the burning of Biomass is designated as “CO2 neutral” by Western Nations to give the appearance of reducing CO2 emissions and thus controlling Climate Change.

The designation of Biomass burning as Carbon neutral is essentially self-defeating as:

burning Biomass massively increases the instantaneous output of CO2 emissions.
those instantaneous CO2 emissions from burning Biomass effectively cancel out  any and all potential CO2 emissions savings from the deployment of Weather-Dependent “Renewable” technologies
is hugely destructive of natural environments and habitats wherever harvested at the necessary industrial scale.
Germany and the UK are leaders in the development of “Renewable” Energy in Europe. This post uses 2019 hourly generation datasets showing the scale of various generation technologies over the year.  It combines that power output data with data on the CO2 emissions of different fossil fuels to show the extent of CO2 emissions in 2019. (continue reading)


The contradictory Green policies to limit CO2 emissions


Tags: Highlighted Article

Dispatchable Wind & Solar - ORIGINAL CONTENT

Electricity demand fluctuates continuously, over a range of 2.5-3 to one. Electric utility operators control the output of numerous generation resources over their acceptable range of operation to match the contemporaneous demand of the grid. Current grid generation resources include nuclear, natural gas, coal, hydroelectric, geothermal, biomass, wind and solar. With the exception of wind and solar, these generation resources are dispatchable, meaning that they can be brought into service, as required, to meet grid demand. Wind and solar availability are controlled by time of day and weather conditions. Regulation typically requires that their output be used whenever available in preference to other resources and that the output of other generating resources be adjusted to accommodate their output.

Electric utilities will continue to require the ability to dispatch generating resources as required to match grid demand as the electricity generating fleet transitions from primarily fossil fueled generation to predominantly intermittent renewable generation. Nuclear generation is typically base loaded, while hydro, geothermal and biomass generation can be modulated to follow load. However, these generation sources would represent less than 10% of the generation required to meet peak demand in the “All-Electric Everything” future beyond 2050. Therefore, wind and solar generation must be rendered dispatchable to maintain grid reliability and stability.

Current US wind generation has capacity factors ranging from approximately 24-46%, with the lower capacity factors in July, August and September. Therefore, 1 GW of dispatchable wind capacity would require up to 4 GW of wind generator rating plate capacity, plus storage capacity of approximately 3 GW to store electricity for use during the periods of low capacity. Additional storage capacity would be required to compensate for daily generation fluctuations around the monthly average. Additional storage capacity would also be required to provide dispatchable output through days of low/no wind generation availability.

Current US solar generation has capacity factors ranging from approximately 17-33%, with lower capacity factors in November, December, January and February. Therefore, 1 GW of dispatchable solar capacity would require up to 6 GW of solar generator rating plate capacity, plus storage capacity of approximately 5 GW to store electricity for use at night and during periods of low capacity. Additional storage capacity would be required to compensate for daily generation fluctuations around the monthly average. Additional storage capacity would also be required to provide dispatchable output through days of low/no solar availability.

The Administration’s goal would result in a grid in which approximately 90% of the electricity generated would be generated by intermittent renewable generation, supplemented by nuclear, hydro geothermal and biomass generation. The rating plate capacity of the intermittent renewable generators would be 4-6 times the expected average capacity and the intermittent renewable generation capacity would require at least equal rating plate storage capacity and perhaps several times that capacity, depending on the number of consecutive days of low/no generation which might be experienced.

Such a system would require a significant factor of safety in its design, since if storage were discharged during a generation outage, recovery would be a long term process.


Tags: Electric Power Generation, Electric Power Dispatchable, Electric Power Reliability, Electric Utilities

Life after Climate Change - Highlighted Article

  • 4/6/23 at 07:00 AM


From: National Review

By: Bjorn Lomborg

Date: March 30, 2023


Life after Climate Change


Better than you think

The global discussion about climate change has become quite hysterical. Some 60 percent of people living in the rich world think it is likely to bring an end to humanity. This is not only untrue; it is also harmful, because fear makes people embrace bad policies and ignore many other urgent challenges facing the world. Consider, for example, how the World Health Organization declared climate change the defining public-health issue of the 21st century in 2014, but perhaps should have been more focused on pandemics, like Covid. Or take the World Economic Forum participants who in January 2020 found the greatest policy risk of the next ten years to be climate-action failure — ignoring the rapid spread of Covid. Or consider how development institutions increasingly focus on helping poor countries with climate-change responses, often at the expense of other things those countries urgently need, such as growth and development, stronger health-care systems, better education, and a more plentiful energy supply.

Climate change is a real and man-made phenomenon, and it will have negative impacts overall. That’s a fact, and it is one that we hear a lot. The “catastrophe narrative,” however, is drowning out many other relevant facts about climate change — for example, that 98 percent fewer people are dying from climate-related disasters today than did a century ago, and that net-zero-emission policies are eye-wateringly costly. The following are eight charts that I think more people should see, to understand that the climate-change data are very different from what we hear in the commonplace narrative. (continue reading)


Life after Climate Change


Tags: Highlighted Article
Search Older Blog Posts