Call or complete the form to contact us for details and to book directly with us
435-425-3414
435-691-4384
888-854-5871 (Toll-free USA)


Contact Owner

*Name
*Email
Phone
Comment
 
Skip to Primary Navigation Skip to Primary Content Skip to Footer Navigation
▽ Explore More ▽ Hide

Climate and Climate Change

Climate and Climate Change

Climate Change

Two days before Halloween, 2011, New England was struck by a freak winter storm. Heavy snow descended onto trees covered with leaves.  Overloaded branches fell on power lines.  Blue flashes of light in the sky indicated exploding transformers.  Electricity was out for days in some areas and for weeks in others. Damage to property and disruption of lives was widespread.

That disastrous restriction on human energy supplies was produced by Nature.  However, current and future energy curtailments are being forced on the populace by Federal policies in the name of dangerous “climate change/global warming”.  Yet, despite the contradictions between what people are being told and what people have seen and can see about the weather and about the climate, they continue to be effectively steered away from the knowledge of such contradictions to focus on the claimed disaster effects of  “climate change/global warming” (AGW, “Anthropogenic Global Warming”). 

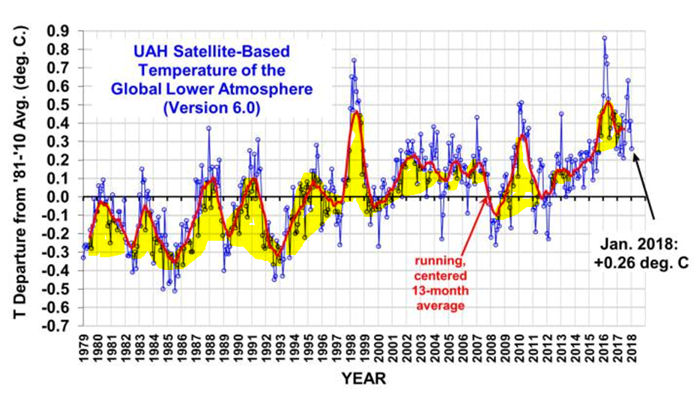
People are seldom told HOW MUCH is the increase of temperatures or that there has been no increase in globally averaged temperature for over 18 years.  They are seldom told how miniscule is that increase compared to swings in daily temperatures. They are seldom told about the dangerous effects of government policies on their supply of “base load” energy — the uninterrupted energy that citizens depend on 24/7 — or about the consequences of forced curtailment of industry-wide energy production with its hindrance of production of their and their family’s food, shelter, and clothing. People are, in essence, kept mostly ignorant about the OTHER SIDE of the AGW debate.

Major scientific organizations — once devoted to the consistent pursuit of understanding the natural world — have compromised their integrity and diverted membership dues in support of some administrators’ AGW agenda.   Schools throughout the United States continue to engage in relentless AGW indoctrination of  students, from kindergarten through university.  Governments worldwide have been appropriating vast sums for “scientific” research, attempting to convince the populace that the use of fossil fuels must be severely curtailed to “save the planet.”  Prominent businesses — in league with various politicians who pour ever more citizen earnings into schemes such as ethanol in gasoline, solar panels, and wind turbines — continue to tilt against imaginary threats of AGW.  And even religious leaders and organizations have joined in to proclaim such threats.   As a consequence, AGW propaganda is proving to be an extraordinary vehicle for the exponential expansion of government power over the lives of its citizens. 

Reasoning is hindered by minds frequently in a state of alarm.  The object of this website is an attempt to promote a reasoned approach; to let people know of issues pertaining to the other side of the AGW issue and the ways in which it conflicts with the widespread side of AGW alarm (AGWA, for short).  In that way it is hoped that all members of society can make informed decisions.

Climate Science “The time has come, …”

Climate science is important. Climate science is a mess. Climate science must be fixed. The new Environmental Protection Agency (EPA) Administrator and the soon to be appointed new National Oceanic and Atmospheric Administration (NOAA) and National Aeronautics and Space Administration (NASA) Administrators have an obligation, either to make the science worth the money being spent on it, or to reduce the money being spent on it to a level commensurate with its apparent value.

The Climategate scandal in 2009 and 2011 began the very public questioning of climate scientists and the conduct of climate science. Climategate exposed Frantic Researchers Adjusting Unsuitable Data, attempting to control peer review, attempting to control or discredit peer reviewed journals, attempting to prevent certain scientists and their research from being published and attempting to ruin the careers of certain scientists. The recent revelations about the conduct of NOAA researchers in the preparation and publication of ‘Possible Artifacts of Data Biases in the Recent Global Surface Warming Hiatus’ by Karl et al., Science 4 June 2015; and, the refusal of the NOAA Administrator to provide materials to a US House committee have rekindled the issue.

The new EPA, NOAA and NASA Administrators should immediately initiate a thorough, joint investigation of the acquisition, analysis and application of climate data by their agencies. This investigation should then expand to include those activities by other nations, the Intergovernmental Panel on Climate Change (IPCC) and the United Nations Framework Convention on Climate Change (UNFCCC). The initial focus of the investigation should be on data quality and data integrity. This should be followed by a focus on climate modeling and the application of climate models, particularly the need to verify climate models before using them as vehicles for producing questionable future scenarios.       

All the agencies using US and global near-surface temperature data to track global warming “adjust” the data because they either KNOW, or have strong reason to BELIEVE, that the data are flawed. The new NOAA and NASA Administrators should immediately question why the agencies have chosen to continue adjusting flawed data, rather than taking steps to ensure that the data they collect for analysis is accurate. Instrument calibration schedules and instrument enclosure and site maintenance schedules should be reviewed and amended as necessary to ensure data quality. Data archiving and storage procedures should also be reviewed and amended as required to ensure data integrity and accessibility. The new Administrators should establish firm policies regarding data and information access, with the expressed intent of eliminating the need for FOIA requests to obtain access.

These investigations and reviews should not be conducted by agency personnel, but rather by “tiger teams” of outside experts in all of the technical fields of concern, with support from agency personnel. Agency personnel should be notified that refusal to cooperate honestly, fully and timely with the tiger teams would be considered a notice of resignation from the agency; and, processed accordingly.

There is general recognition that the data available from satellites is more comprehensive than the data available from surface and near-surface sources. However, there is continuing disagreement regarding the relationship between satellite data and surface and near-surface data. The Administrators should redirect funds currently spent on studies applying unverified models to produce future scenarios of questionable value. These funds should be used instead to fund studies to resolve the differences between the various data sources, since such studies would likely result in an enhanced understanding of the atmosphere and the processes occurring within it.

Tags: Bad Science, Climate Science, 2016 election, Temperature Record, Climate Models

Oxymoron Alert (Carbon Taxes)

The Climate Leadership Council has just released a new study “The Conservative Case for Carbon Dividends” and presented it to the Trump Administration for its consideration. The study identifies Four Pillars of a Carbon Dividends Plan:

            1. A GRADUALLY INCREASING CARBON TAX

            2. CARBON DIVIDENDS FOR ALL AMERICANS

            3. BORDER CARBON ADJUSTMENTS

            4. SIGNIFICANT REGULATORY ROLLBACK

Interestingly, the study focuses on the carbon dividend in its title, rather than on the carbon tax. I would argue that a carbon tax is hardly “conservative”. I would also argue that it is not a “market mechanism”, though it would rely on market mechanisms to adapt to the market distortions caused by the tax. The magnitude of the market distortion which would be caused by a carbon tax of ~$40 per ton of CO2 emissions is estimated to be ~$500 per US social security card holder. It would manifest in the economy as an increase in the cost of every good and service; a tax-driven cost push inflation of prices.

The study begins with the premise that global CO2 emissions are undesirable and must be reduced; that is, it assumes that continued CO2 emissions would lead to catastrophic anthropogenic global warming (CAGW). The study also begins with the premise, shared by many economists, that a carbon tax is the most efficient approach to reducing carbon emissions. The study suggests that the recommended carbon tax would be a Pigouvian tax; that is, a tax intended to discourage activities which lead to negative externalities. However, this suggestion ignores any positive externalities associated with CO2 emissions, though positive externalities exist; and, might well currently dominate at present. It is more likely that the recommended tax is simply a “sin” tax, particularly since it is intended to increase over time until the identified “sin” (CO2 emissions) is eliminated.

A carbon tax at a given level does not reliably produce a CO2 emissions reduction of a specific magnitude or percentage. This is particularly true in the short term, as the market response to the tax is affected both by the availability of economic alternative technologies and by the remaining economic useful life of existing equipment in service. The carbon tax does have the flexibility to be increased progressively, as required, to drive the desired emissions reduction. Clearly, the ultimate goal of the tax is to drive CO2 emissions in the US to zero, which would essentially require a transition to an all-electric energy economy, with all electricity provided by nuclear and / or renewables. It is unclear how high the carbon tax would have to be to achieve that objective. It is clear the tax would penalize the current transition from coal to natural gas as the predominant fuel for electric power generation, which has been largely responsible for the reductions in US CO2 emissions over the past several years. It might also constrain that transition in the short term, by discouraging investment in the additional natural gas pipeline and storage capacity required to supply the growing natural gas generation base.

The carbon dividend is a thinly disguised form of income redistribution, since it would provide a uniform quarterly dividend to all US social security cardholders, regardless of the amount of carbon tax, if any, directly or indirectly paid by that social security cardholder. The carbon dividend would likely be popular, particularly among the ~70% of social security cardholders expected to receive a dividend greater than their tax expense. The carbon tax would be imposed upstream of the consumer and would probably appear to be a price increase imposed by suppliers and service providers, rather than as a flow-through tax. Therefore, many dividend recipients would blame suppliers and service providers for the price increases, though they would thank the federal government for the dividend.

The border carbon adjustments process would be extremely complex and costly. There would likely be massive disagreements over the “carbon content” of manufactured goods and the impacts of any carbon emissions reduction efforts on the part of the government of the country in which the imported goods were manufactured. The numbers of products and the number of countries from which they are imported, combined with technology changes over time, would make this a long term ongoing process.

The “significant regulatory rollback” would fly in the face of the regulatory agencies’ imperative to survive and grow. Certainly the tax would be preferable to the current and growing command and control “rats nest” which is environmental regulation. However, in this instance, neither the regulatory morass nor the tax appears to be necessary, absent near-religious belief in the scenarios produced by unverified climate models.

In my early youth, I believed in Santa Claus, the Easter Bunny and the Tooth Fairy. In my advancing maturity, I find it impossible to believe in a revenue neutral tax. The history of “cap and trade” (cap and tax) legislation in the US strongly suggests that the Congress is incapable of producing such a tax.


Related Articles:

Tags: Carbon Tax

Highlighted Article: At What Cost? Examining The Social Cost Of Carbon

  • 3/9/17 at 05:49 AM

Here is an excellent article we would like to highlight from Cato Institute's Patrick J. Michaels.

At What Cost? Examining The Social Cost Of Carbon

"My testimony concerns the selective science that underlies the existing federal determination of the Social Cost of Carbon and how a more inclusive and considered process would have resulted in a lower value for the social cost of carbon."

Tags: Highlighted Article

More Anomalous Anomalies

The three primary producers of global near-surface temperature anomalies, NASA GISS(Goddard Institute for Space Studies), NOAA NCEI(National Centers for Environmental Information) and HadCRUT all begin the process with access to the same data. They then select a subset of the data, “adjust” the data to what they believe the data should have been; and, calculate the current “adjusted” anomalies from the previous ”adjusted” anomalies. NASA GISS alone “infills” temperature estimates where no data exist. Each producer then independently prepares their global temperature anomaly product.

The calculated anomaly in any given month relates directly to a global average temperature for that month. The difference between the calculated anomalies in any pair of months is thus the same as the difference between the calculated global average temperatures for those months. However, the differences reported by the three primary producers of global average temperature anomaly products from month to month, or year to year, are rarely the same; and, the changes are not always even in the same direction, warming or cooling.

The global average temperature anomaly differences reported by the three primary producers of global near-surface temperature anomalies for the months of November and December, 2016 are an interesting case in point. NASA GISS reported a decrease of 0.12oC for the period. NOAA NCEI reported an increase of 0.04oC. HadCRUT reported an increase of 0.07oC. Each provider estimates a confidence range of +/- 0.10oC for their reported anomalies. (NASA GISS: -0.22oC / -0.12oC / -0.02oC; NOAA NCEI: -0.06oC / +0.04oC / +0.14oC; HadCRUT: -0.03oC / +0.07oC / +0.17oC) Therefore, the confidence ranges overlap, suggesting that the differences among the anomaly estimates are not statistically significant. However, it is clear that the global average near-surface temperature did not both increase and decrease from November to December.

The second decimal place in each of these reported anomalies is not the result of temperature measurement accuracy, but rather of numerical averaging of less accurate “adjusted” temperature estimates resulting from data “adjustment”. The Law of Large Numbers states that it can be appropriate to express calculated averages to greater precision than the precision of the numbers being averaged, if the errors in the individual numbers are random. However, the nature of the factors which cause individual temperature measurements to be inaccurate and thus require “adjustment” suggests that the resulting errors are not random. Certainly, the “adjustments” made to the data are not random. Therefore, it is highly unlikely that reporting global average near-surface temperatures to greater precision than the underlying “adjusted” temperature data is appropriate.

Tags: Temperature Record, Global Temperature

Hottest Year Time Again

The near-surface global temperature anomaly data for 2016 have been collected, selected, infilled, “adjusted” and analyzed. The results are in; and, again, they are anomalous. NASA GISS(Goddard Institute for Space Studies) and NOAA NCEI(National Centers for Environmental Information) both report the average anomaly for 2016 as 0.99oC. This represents an increase of 0.13oC for the NASA GISS anomaly, compared with 2015; but, an increase of 0.09oC for the NOAA NCEI anomaly, compared with 2015. Both NASA GISS and NOAA NCEI place the confidence limits on their reported anomaly at +/- 0.10oC, or approximately the same magnitude as the reported year to year global average anomaly change. Both NASA GISS and NOAA NCEI estimate that the influence of the 2015/2016 El Nino contributed 0.12oC to the increase in the reported anomaly for 2016, 0.01oC less than the global average anomaly increase reported by NASA GISS and 0.03oC more than the global average anomaly increase reported by NOAA NCEI. That is, essentially all of the 2016 global average temperature anomaly increase reported by both agencies was the result of the influence of the 2015/2016 El Nino, which was very similar in magnitude to the 1997/1998 El Nino, which are the two strongest El Ninos recorded in the instrumental temperature record. HadCRUT reported an average anomaly of 0.774oC, an increase of 0.14oC from the 2015 average anomaly. HadCRUT estimated similar confidence limits and a similar El Nino contribution.

All of the near-surface temperature anomaly products reported dramatic drops in their anomalies, beginning in the Spring of 2016, though these drops were from record high monthly peaks driven by the El Nino. The NASA GISS anomaly dropped from a high of 1.36oC to a December 2016 level of 0.81oC, a change of -0.55oC. The NOAA NCEI anomaly dropped from a high of 1.22oC to 0.79oC, a change of -0.43oC. The HadCRUT4 anomaly dropped from a high of 1.08oC to 0.59oC, a change of -0.49oC. This a variance of 0.12oC between the near-surface temperature anomaly products, approximately equal to the magnitude of the reported 2016 anomaly increases, the estimated impact of the 2015/2016 El Nino and half the confidence range claimed for the reported anomalies.

University of Alabama Huntsville (UAH)  and Remote Sensing Systems (RSS) both reported that 2016 was 0.02oC warmer than 1998, which both sources still report as the previous warmest year in the satellite temperature record. Dr. Roy Spencer of UAH stated that the increase in the reported temperature anomaly between 1998 and 2016 would have had to be ~0.10oC to be statistically significant. The UAH anomaly dropped from a 2016 high of 0.83oC to a December 2016 level of 0.24oC, a change of -0.59oC. The RSS anomaly dropped from a 2016 high of 1.0oC to a December level of 0.23oC, a change of -0.77oC. Both the UAH and RSS anomalies show the dramatic impact of the 2015/2016 El Nino. Both anomalies suggest that the “Pause” has returned, since they show no statistically significant warming since at least 1998.

The question now is whether there will be a La Nina in 2017; and, if so, the extent to which it will further reduce the post El Nino anomalies.

Tags: Warmest, Global Temperature, Temperature Record

Highlighted Article: Climate Models for the Layman

  • 2/22/17 at 07:29 AM

Here is an excellent paper on climate models by Dr. Judith Curry and The Global Warming Policy Foundation (GWPF).

Climate Models for the Layman

"This report attempts to describe the debate surrounding GCMs to an educated but nontechnical audience."

Tags: Highlighted Article

Opening the Kimono

Steve Goreham, the author of the book Climatism! Science, Common Sense, and the 21st Century's Hottest Topic coined the term Climatism, which he defines as “the belief that man-made greenhouse gas emissions are destroying the Earth's climate". Arguably, the definition should include the assertion “that man-made greenhouse gas emissions are destroying the Earth's climate", even absent belief in the assertion.

Ari Halperin manages the blog Climatism. (https://climatism.wordpress.com/) Early in 2016, Halperin authored a guest essay on Watts Up With That (http://wattsupwiththat.com) entitled Who unleashed Climatism (https://wattsupwiththat.com/2016/01/17/who-unleashed-climatism/) in which he discusses the origins of climate alarmism at length. He concludes that: “Climatism is a foreign assault on America. The aggressor is not another nation-state, but an alliance of UN agencies and environmental NGOs.”

Leo Goldstein (http://defyccc.com/) has recently posted two guest essays on Watts Up With That: https://wattsupwiththat.com/2016/12/23/the-command-control-center-of-climate-alarmism/; and, https://wattsupwiththat.com/2017/01/05/is-climate-alarmism-governance-at-war-with-the-usa/. Goldstein has coined two new terms in these essays: Climate Alarmism Governance (CAG); and, Climintern (Climatist International). Goldstein traces the history of CAG from the founding of the Climate Action Network (CAN) in 1989. CAN now has 1100+ members globally. CAN, the UN and numerous foundations provide CAG; and, are referred to collectively as the Climintern.

The Climintern refers to the analyses provided by Halperin and Goldstein as conspiracy theories. Others might refer to them as conspiracy exposes or histories. The documentation they provide in these essays clearly establishes the nature and scope of CAG and the influence of the Climintern. Their analyses are well worth reading. They provide a historical record of how climatism has proceeded from its earliest days to today; and, how it works to influence global and national climate policy through the UNFCCC and the UN IPCC.

“If it looks like a duck, swims like a duck, and quacks like a duck, then it probably is a duck.” (HT: James Whitcomb Riley)

Tags: Climate Skeptics

Another One Bites the Dust – Judith Curry Resigns

Dr. Judith Curry has resigned her position at Georgia Tech, in frustration over “the politics and propaganda that beset climate science”. Dr. Curry explained,

“the deeper reasons have to do with my growing disenchantment with universities, the academic field of climate science and scientists… I no longer know what to say to students and postdocs regarding how to navigate the CRAZINESS in the field of climate science. Research and other professional activities are professionally rewarded only if they are channeled in certain directions approved by a politicized academic establishment — funding, ease of getting your papers published, getting hired in prestigious positions, appointments to prestigious committees and boards, professional recognition, etc.”
“How young scientists are to navigate all this is beyond me, and it often becomes a battle of scientific integrity versus career suicide.” (https://judithcurry.com/2017/01/03/jc-in-transition/)

Dr. Curry’s concerns regarding university climate science education do not bode well for the future of climate science over the next 30-40 years.

Dr. Curry follows Dr. Roger Pielke, Jr., who did not resign his faculty position at the University of Colorado, but has redirected his research efforts away from climate science. (http://www.wsj.com/articles/my-unhappy-life-as-a-climate-heretic-1480723518)

Other climate scientists, including Dr. David Legates (formerly Delaware State Climatologist) and Dr. Noelle Metting (formerly US DOE) were terminated for failing to adhere to the political climate change narrative. (http://www.delawareonline.com/story/news/local/2015/02/26/university-delaware-professor-caught-climate-changecontroversy/24047281/)

(http://freebeacon.com/politics/congress-obama-admin-fired-top-scientist-advance-climate-change-plans/)

Dr. Wei-Hock Soon and Dr. Sallie Baliunas, both of the Harvard-Smithsonian Center for Astrophysics have been under attack since 2003 for their work on the solar contribution to climate change. (Dr. Baliunas has since retired.)

The Climategate e-mails released in 2009 and 2010 exposed efforts on the part of members of the consensed climate science community to destroy the careers of other climate scientists, including Dr. Christopher deFrietas, Dr. Christopher Landsea and Dr. Patrick Michaels. Fortunately, these efforts were unsuccessful.

The life of a non-consensed climate scientist is hardly a bed of roses.

Tags: Climate Consensus

“Mann Overboard”

Much has been written this year about the 2015/2016 El Nino and about the apparent record global temperature anomalies. Professor Michael Mann of Penn State University was quick to provide his opinion that the El Nino contributed only about 0.1oC, or about 15%, to the 2015/2016 global average temperature anomaly increase. Others provided estimates ranging from 0.07oC to 0.2oC. The balance of the temperature anomaly increases was attributed to the continuing increase in atmospheric CO2 concentrations as the result of human fossil fuel combustion.

However, the 2015/2016 El Nino is now over; and, global temperature anomalies have dropped sharply: by approximately 0.4oC overall; and, by approximately 1.0oC over land only. The sea surface temperature anomalies are expected to decrease further, although more slowly, especially if a significant La Nina develops in 2017. The equatorial Pacific is in a weak La Nina condition at present, but La Nina conditions appear to be weakening.

Regardless, Mann and others who minimized the potential contribution of the 2015/2016 El Nino to the rapid global temperature anomaly increases in those years are now faced with explaining the large, rapid decreases in the global average anomalies following the end of the El Nino. It would be difficult enough to explain rapid anomaly increases in association with slow increases an atmospheric CO2 concentrations; but, even more difficult to explain rapid anomaly decreases in association with slow increases in atmospheric CO2 concentrations.

Tags: Temperature Record, Global Temperature

“Just the facts, ma’am.”

“Politics is a battle of ideas; in the course of a healthy debate, we’ll prioritize different goals, and the different means of reaching them. But without some common baseline of facts; without a willingness to admit new information, and concede that your opponent is making a fair point, and that science and reason matter, we’ll keep talking past each other, making common ground and compromise impossible.”

– President Obama (Jan. 10, 2017)

Simple Definition of fact

  • : something that truly exists or happens : something that has actual existence
  • : a true piece of information

Source: Merriam-Webster's Learner's Dictionary


“Just the facts, ma’am.” #1

Some simple words are often used imprecisely. In discussions related to climate science, the simple word “fact” is a case in point. For example, a temperature measurement taken by an observer from a particular instrument, in a particular enclosure, at a particular location and at a particular time is frequently referred to as a “fact”. However, it is only a “fact”, as defined above, in those particular circumstances. It is not necessarily and not even likely “a true piece of information”, in the broader sense, since it is affected by those circumstances.

Temperature measurements taken “near-surface” are “selected” for inclusion in the temperature record; and, are then “adjusted” to account for the particular instrument, enclosure, location and time of observation. These “adjusted” measurements are not “something that truly exists or happens”, but rather an estimate of something that might “truly exist or happen”.

An “ideal” near-surface temperature measurement site is identified as follows: Climate Reference Network (CRN) Site Information Handbook

Class 1– Flat and horizontal ground surrounded by a clear surface with a slope below 1/3 (<19º). Grass/low vegetation ground cover <10 centimeters high.    Sensors located at least 100 meters from artificial heating or reflecting surfaces, such as buildings, concrete surfaces, and parking lots.  Far from large bodies of water, except if it is representative of the area, and then located at least 100 meters away.  No shading when the sun elevation >3 degrees.

Such a site is estimated to be able to produce a near-surface temperature measurement with an error of less than 1oC, assuming proper instrument selection and calibration, proper enclosure and timely reading. Such a measurement is a “fact”, subject to those limitations.

Climate science deals with these errors of “fact” regarding near-surface temperature measurements by using temperature anomalies, or the differences between temperature measurements taken at a particular site. These anomalies are “facts” only if there have been no changes in any of the circumstances which affect the measurements; and, they cease to be facts if the measurements are “adjusted”, rendering them merely estimates.


“Just the facts, ma’am.” #2

Above I discussed the limitations on “facts”; and, the difference between facts and estimates related to individual temperature measurements, whether analyzed as discrete temperatures or temperature anomalies.

Once near-surface temperature measurements have been recorded, selected and “adjusted”, the next step in the process is to combine these selected, “adjusted” temperature estimates, expressed as anomalies from previous selected, “adjusted” temperature estimates, into an estimated global average near-surface temperature anomaly. While it might be argued that errors in the recorded temperature measurements might be random, it cannot be argued that the selection of the temperature measurements to be included in the global average calculation or the “adjustments” made to these temperature measurements are random. There could be no rational explanation for making random “adjustments” to measurements.

The estimated global average surface temperature anomaly is reported to two decimal place “precision”; and, used to calculate decadal rates of temperature increase to three decimal place “precision”. This level of “precision” is highly questionable, bordering on ridiculous, considering the inaccuracy of the underlying temperature measurements. The underlying temperature measurements are estimated to be in absolute error by an average of more than 2oC in the US, where they have been surveyed and their siting compared to the US CRN1 siting requirements. The expected inaccuracy of the remaining global temperature measuring stations is assumed to be similar, though they have not been surveyed and their siting compared to the US CRN1 siting requirements.

Finally, the estimated “adjusted” global average temperature is reported to two decimal place “precision”. This estimate is reported as a “fact”, though the particular circumstances under which the estimate might have been a “fact” are ignored.


“Just the facts, ma’am.” #3

“Just the facts, ma’am.” (1 & 2) discussed “facts” in the context of individual near-surface temperature measurements and global average temperature anomaly calculations. The final step in the climate change analysis process is the creation of future climate change scenarios using climate models.

There are numerous climate models, none of which have been verified. Therefore, it cannot be said that there is a climate model which is a “fact”, in the sense that it accurately models “something that truly exists or happens”, rather than hypothesizes something which might happen if the model were accurate.

The climate models are run using a range of inputs for climate sensitivity and climate forcings, because there are no specific, verified values for the various sensitivities and forcings. Therefore, not only are the climate models not “facts” (“something that truly exists or happens”), the inputs which feed the models are not “facts” either, in the sense that they are “a true piece of information”. It is not even a “fact” that the actual climate sensitivity or actual climate forcings are within the ranges of the values used as inputs to the models.

Therefore, the modeled scenarios of future climate change (temperature change) are not “facts”, or arguably even based on facts. Rather, they are estimates, based on estimates, of the potential change in current estimates over some future period.

Based on the “facts”, as discussed in these commentaries, there is only a tenuous basis for concern about catastrophic anthropogenic climate change.

That’s “Just the facts, ma’am.” (HT: Sgt. Joe Friday, LAPD)

Tags: Temperature Record, Estimates as Facts, Global Temperature, Adjusted Data

Priorities

One of the principal concerns raised regarding climate change is its potential effects on agriculture. There is continuing discussion that the potential combination of increased temperatures with drought or increased rainfall might result in reduced crop yields or crop failure in some or all of the traditional crop production regions. There is also continuing discussion of the perceived need to reduce meat consumption, so that grazing land could be converted to food production.

There is little discussion of the likelihood that production of these food crops would move to areas which have been too cold or had too short growing seasons in the past. There is also little recognition of the contribution of plant genetics to increased plant tolerance and yield.

However, in the face of all of this concern about food production, at least in the United States, the number one cash crop in ten US states is marijuana, as shown in the attached table. Marijuana is among the top five cash crops in a total of 39 of the 50 states; and, among the top ten cash crops in all but 2 states.

This is not to suggest that marijuana is a major crop in any of these states by volume or weight, or that it is crowding out production of other crops for human or animal consumption, including export. Rather, it is to suggest that a very high value has been placed on a crop which has no food value (even when baked into brownies), in the face of vocal concern about the adequacy of future food production.

Current efforts to legalize the consumption of marijuana for other than medicinal purposes will likely increase the demand for the product, increasing the productive acreage dedicated to its production, though it might also result in corresponding reductions in its commercial value. One has to question whether this agricultural product should have such a high priority.


Marijuana Rank as Cash Crop, by State

Alabama 1 Louisiana 6 Ohio 4
Alaska NA Maine 1 Oklahoma 3
Arizona 3 Maryland 5 Oregon 4
Arkansas 4 Massachusetts 2 Pennsylvania 5
California 1 Michigan 5 Rhode Island 1
Colorado 4 Minnesota 6 South Carolina 3
Connecticut 1 Mississippi 3 South Dakota 9
Delaware 3 Missouri 4 Tennessee 1
Florida 2 Montana 4 Texas 6
Georgia 3 Nebraska 9 Utah 2
Hawaii 1 Nevada 2 Vermont 2
Idaho 5 New Hampshire 2 Virginia 1
Illinois 4 New Jersey 7 Washington 5
Indiana 3 New Mexico 2 West Virginia 1
Iowa 4 New York 2 Wisconsin 6
Kansas 6 North Carolina 5 Wyoming 8
Kentucky 1 North Dakota ?    


Source: NORML (USDA data)

Tags: Agriculture

A Little Perspective

The angst-ridden, consensed climate science community is focused on an increase in global average near-surface temperature of approximately 0.7°C (1.3°F) per century, or a total increase of approximately 0.9°C (1.6°F) since 1880, according to NOAA.

To provide some perspective on the cause of this angst, I have selected Wichita, Kansas, a city located very near the geographic center of the contiguous 48 states of the US. The data source for this analysis is weather.com.

The record high temperature in Wichita is 114°F. The record low is -22°F. That is a difference of 136°F between the record high and low temperatures over the same period that NOAA reports a global average near-surface temperature increase of approximately 1.6°F.

The typical range of daily high and low temperature in Wichita is approximately 20°F throughout the year. Assuming that the transition from the daily low temperature to the daily high temperature occurs over a period of approximately 12 hours, the rate of diurnal temperature change in Wichita is approximately 1.7°F per hour, or approximately the same as the total change in global average near-surface temperature over the 136 years since 1880.

NOAA reports the global average near-surface temperature as approximately 57°F. Wichita average temperatures range from approximately 32°F in January to approximately 80oF in July, relatively close to the global average near-surface temperature. This is a local average temperature change of approximately 0.3°F per day, or approximately one fifth of the total reported change of global average near-surface temperature over the 136 years since 1880.

It is also interesting to compare the rates of change of temperature. The approximately 0.3°F daily rate of local average seasonal temperature change in Wichita is approximately 10 thousand times the reported rate of global average near-surface temperature change over the 136 year period since 1880. The approximately 1.7°F per hour rate of change of diurnal temperature in Wichita is approximately 1.2 million times the reported rate of change of global average near-surface temperature over the same period.

Similar analyses in other areas of the globe would produce similar, though not identical, results. Clearly, all life forms on earth experience far more rapid temperature changes on a daily and seasonal basis than the earth has experienced on a global basis over the past 136 years. Also, the global change has manifested predominantly as warmer nights and milder winters, rather than as increased maximum temperatures, thus reducing the stress imposed by the increase.

Tags: Global Temperature, Temperature Record

Personal Precautions

One of the idyllic images cherished by many environmentalists concerned about the climate is life “off the grid”, free of utilities, living off the land, minimizing their impact on the planet. However, reality frequently rears its ugly head, blurring the idyllic image.

I recently had the opportunity to spend several days visiting with friends who live on a quarter section in-lot (160 acres), completely surrounded by Bureau of Land Management land. They are not connected to the electric grid, to natural gas distribution, or to municipal or private water service. They do have radio-telephone service; and, satellite service for the internet and television.

They use both dual-axis tracking and fixed solar photovoltaic collectors to provide their electricity; and, they store excess electricity generated during the day in a battery bank to meet their needs when the sun isn’t shining. They also had, but have since removed, a wind turbine, which proved to be both inefficient and problematic. However, as a precaution, they also have a propane-powered generator, equipped with an automatic transfer switch to pick up the load when necessary.

They use solar thermal collectors to produce hot water, both for domestic use and as the heat source for the in-floor hydronic system, which provides the primary source of space heating for their home. However, as a precaution, they have both a propane-fueled instantaneous water heater and a propane-fueled furnace, as well as two wood stoves.

Their home is located in an area which receives relatively little rain and snow, so the availability of water is a prime concern. They collect their water from the roofs of their home and garages; and, store several thousand gallons of water in four large storage tanks. They also use composting toilets to reduce water consumption and avoid sanitary water (black water) disposal issues.

Their vehicles are all gasoline-fueled. Electric vehicles would require installation of additional solar or wind generation capacity; and, far greater useful vehicle range.

This is not to suggest that the idyllic life “off the grid” is not possible, but rather that it requires extensive and careful precautionary planning to assure continuous quality of life; and, technological evolution to “fill in the blanks”.

Tags: Backup Power

Common Precaution

Many climate activists claim that the Precautionary Principle requires that humanity cease using fossil fuels to avoid the potential of catastrophic anthropogenic climate change. That is a relatively absolutist interpretation of the Precautionary Principle, particularly based on the uncertainties surrounding the purported adverse effects of increased atmospheric CO2 concentrations.

Society, in general, applies the Precautionary Principle quite differently. Humanity does not cease flying, or taking trains, or driving vehicles, or walking because of the potential of injury or death in an accident. Planes, trains and vehicles are inspected to minimize the likelihood of failure leading to an accident. People are careful how and where they walk to minimize the possibility of an accident.

People do not decide not to build homes or apartments near the ocean, because storms might damage their property. Rather, they design and build their homes to minimize the potential of damage from wind or storm surge. Insurers, likewise, do not refuse to insure these dwellings because of the potentially higher risk, but rather charge higher rates to insure these properties because of the higher risk.

People do not refuse to live in areas where tornadoes are a possibility, but they do install tornado shelters to protect themselves from possible harm. Likewise, people do not refuse to live in areas subject to earthquakes, but they do design and build their homes to minimize potential damage. Insurers, again, do not refuse to insure buildings in such areas, but do charge higher rates to insure these properties because of the higher risk.

People even participate voluntarily in risky activities, such as skydiving, bungee jumping and various other activities and sports, though they attempt to assure that the risks of their participation are minimized.

Tags:

“I’m from the government … …and, I’m here to help you.”

“The whole aim of practical politics is to keep the populace alarmed (and hence clamorous to be led to safety) by menacing it with an endless series of hobgoblins, all of them imaginary.”

H. L. Mencken


We hear much about the Precautionary Principle as believers in Catastrophic Anthropogenic Global Warming (CAGW) would have it applied to avoid the possibility of catastrophic climate change. However, we hear little about it when applied to everyday issues, such as drought; and, particularly when government has failed to apply it to predictable problems, such as periodic drought events in desert regions.

The State of California is a prime example of the failure of government to apply the Precautionary Principle in the case of the current drought. The population of California has approximately doubled since the most recent water supply dam was commissioned in the state. Caution would have suggested the need to increase water impoundment to meet the needs of this growing population while continuing to provide the water required for agricultural irrigation in the state.

While the hobgoblin of drought induced by climate change might be imaginary, as Mencken suggested, the hobgoblin of drought is all too real; and, its adverse effects are magnified by the state’s failure to prepare for a fully anticipatable future event. These effects will manifest themselves nationally in limited availability and increased costs of vegetables, fruits and nuts grown in the state. The central valley of California is littered with abandoned fields and orchards deprived of contracted quantities of irrigation water.

Government would have the populace depend on it for a broad variety of services. However, this is one case in which the government has clearly failed to plan adequately for the provision of those services. Interestingly, in the face of the current drought, California is planning a high speed rail system, but not new water impoundments.

It is not clear what the proposed high speed rail system is a precaution against, but it is certainly not the effects of prolonged drought.

Tags: Policy, Drought
Search Older Blog Posts