
Climate Change

Two days before Halloween, 2011, New England was struck by a freak winter storm. Heavy snow descended onto trees covered with leaves. Overloaded branches fell on power lines. Blue flashes of light in the sky indicated exploding transformers. Electricity was out for days in some areas and for weeks in others. Damage to property and disruption of lives was widespread.
That disastrous restriction on human energy supplies was produced by Nature. However, current and future energy curtailments are being forced on the populace by Federal policies in the name of dangerous “climate change/global warming”. Yet, despite the contradictions between what people are being told and what people have seen and can see about the weather and about the climate, they continue to be effectively steered away from the knowledge of such contradictions to focus on the claimed disaster effects of “climate change/global warming” (AGW, “Anthropogenic Global Warming”).
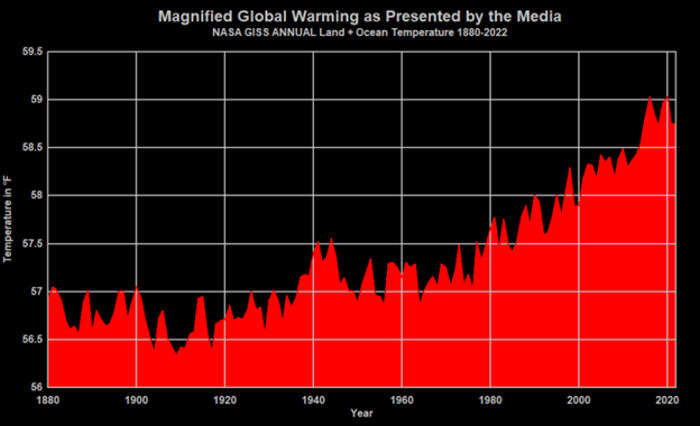
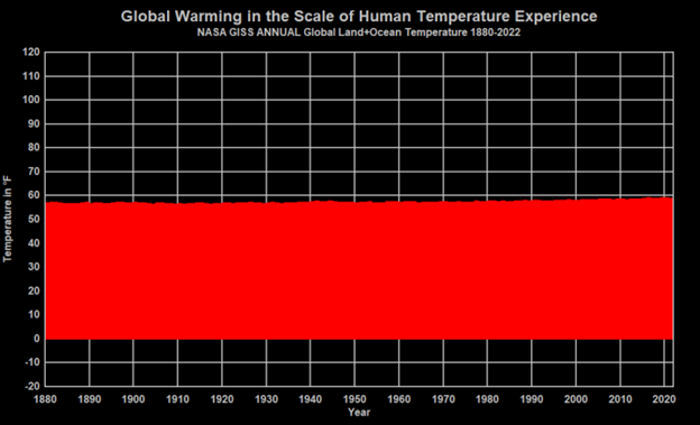
People are seldom told HOW MUCH is the increase of temperatures or that there has been no increase in globally averaged temperature for over 18 years. They are seldom told how miniscule is that increase compared to swings in daily temperatures. They are seldom told about the dangerous effects of government policies on their supply of “base load” energy — the uninterrupted energy that citizens depend on 24/7 — or about the consequences of forced curtailment of industry-wide energy production with its hindrance of production of their and their family’s food, shelter, and clothing. People are, in essence, kept mostly ignorant about the OTHER SIDE of the AGW debate.
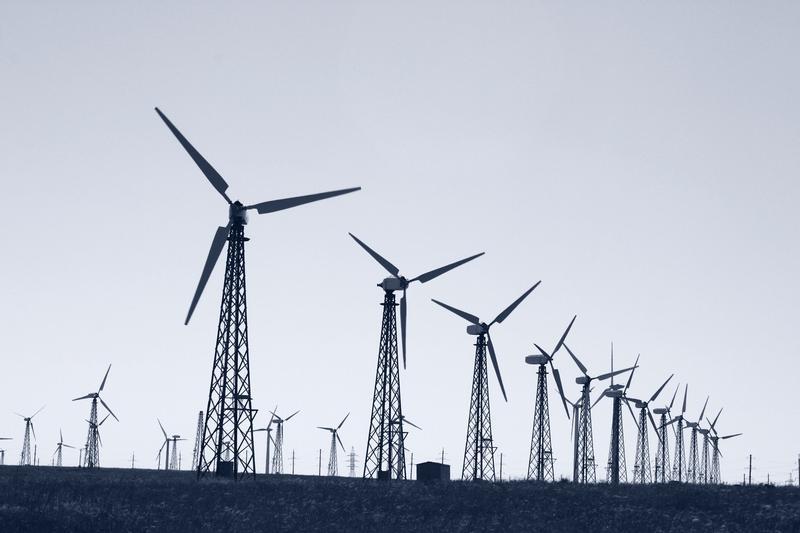
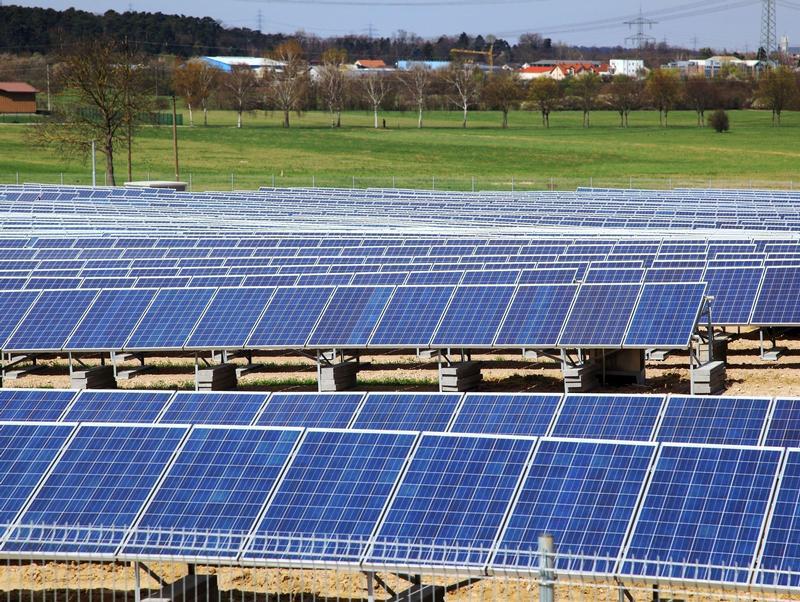
Major scientific organizations — once devoted to the consistent pursuit of understanding the natural world — have compromised their integrity and diverted membership dues in support of some administrators’ AGW agenda. Schools throughout the United States continue to engage in relentless AGW indoctrination of students, from kindergarten through university. Governments worldwide have been appropriating vast sums for “scientific” research, attempting to convince the populace that the use of fossil fuels must be severely curtailed to “save the planet.” Prominent businesses — in league with various politicians who pour ever more citizen earnings into schemes such as ethanol in gasoline, solar panels, and wind turbines — continue to tilt against imaginary threats of AGW. And even religious leaders and organizations have joined in to proclaim such threats. As a consequence, AGW propaganda is proving to be an extraordinary vehicle for the exponential expansion of government power over the lives of its citizens.
Reasoning is hindered by minds frequently in a state of alarm. The object of this website is an attempt to promote a reasoned approach; to let people know of issues pertaining to the other side of the AGW issue and the ways in which it conflicts with the widespread side of AGW alarm (AGWA, for short). In that way it is hoped that all members of society can make informed decisions.
Climate Change News
Economic Reality - ORIGINAL CONTENT
- 5/7/24 at 06:00 AM

How to Destroy The Myth of Cheap Wind and Solar - Highlighted Article
- 5/2/24 at 06:00 AM
All-Electric Storage - ORIGINAL CONTENT
- 4/30/24 at 06:00 AM
Which Power Source is Best - Highlighted Article
- 4/25/24 at 06:00 AM
No Gas Storage - ORIGINAL CONTENT
- 4/23/24 at 06:00 AM
The extraordinary climate events of 2022-24 - Highlighted Article
- 4/18/24 at 06:00 AM

No Coal Storage - ORIGINAL CONTENT
- 4/16/24 at 06:00 AM
200 Ways the Biden Administration and Democrats Have Made it Harder to Produce Oil & Gas - Highlighted Article
- 4/11/24 at 06:00 AM

Current Storage Deficit - ORIGINAL CONTENT
- 4/9/24 at 06:00 AM

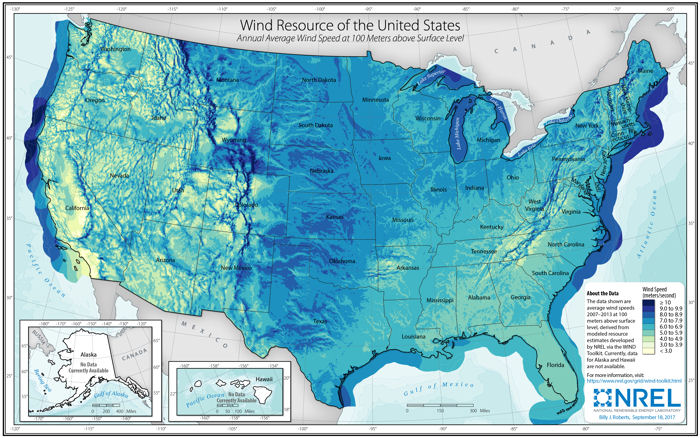
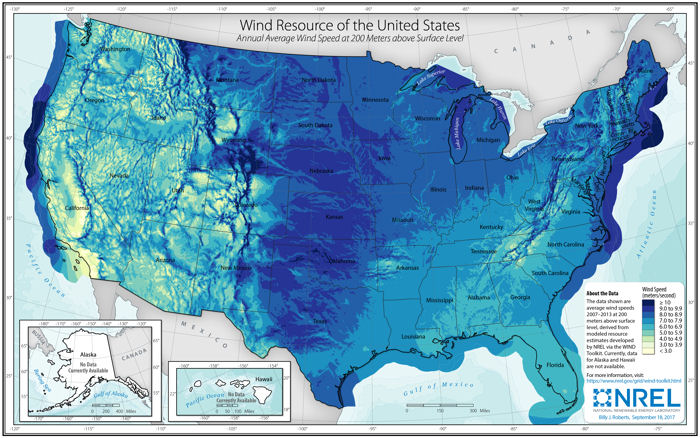
Wind Capacity Factor - ORIGINAL CONTENT
- 4/2/24 at 06:00 AM

Climate Model Bias Series - Highlighted Series
- 3/28/24 at 06:00 AM
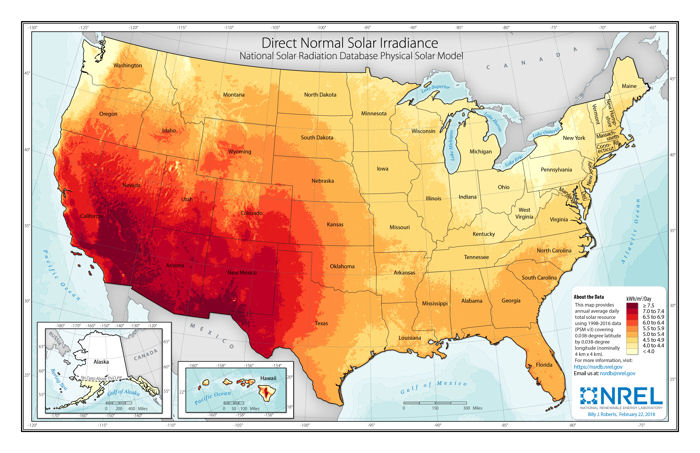
Solar Capacity Factor - ORIGINAL CONTENT
- 3/26/24 at 06:00 AM
The ‘Energy Trilemma’ And The Cost Of Electricity – OpEd - Highlighted Article
- 3/21/24 at 06:00 AM

Anomaly vs. Temperature - ORIGINAL CONTENT
- 3/19/24 at 06:00 AM
-
Headlines
Search Headlines-
False, Sustainability Magazine, Heat Waves Aren’t Breaking the Grid
- Climate Realism
- July 3, 2025
-
Institute for Policy Integrity: Power Plant Pollution is Clearly Significant
- Watts Up With That
- July 3, 2025
-
Natural Gas to the Rescue… Again
- Watts Up With That
- July 2, 2025
-
Trump’s America Burning More Coal As Power Demand Surges
- Daily Caller
- July 2, 2025
-
Burning Trash for Energy, People and Planet
- Watts Up With That
- July 2, 2025
-
EPA asks White House to bless rollback of 2009 CO2 endangerment finding
- Climate Depot
- July 2, 2025
-
Green energy lobby claimed for decades that wind & solar subsidies would be temporary — BUT 50 years later, we’re told that ending taxpayer handouts means the certain death to industry — despite hundreds of billions already handed out
- Climate Depot
- July 1, 2025
-
Activists call for climate skepticism to be outlawed, and experts say it shows growing desperation
- Just the News
- July 1, 2025
-
The Energy Trifecta: Nuclear, Fossil Fuels…and Geothermal Energy
- Legal Insurrection
- June 30, 2025
-
Solar Tax Credits: 1978–2025 (never enough)
- Master Resource
- June 30, 2025
-
-
Scholars Wanted
 The Right Insight is looking for writers who are qualified in our content areas.
