Call or complete the form to contact us for details and to book directly with us
435-425-3414
435-691-4384
888-854-5871 (Toll-free USA)


Contact Owner

*Name
*Email
Phone
Comment
 
Skip to Primary Navigation Skip to Primary Content Skip to Footer Navigation

In the Wake of the News

How Much Storage?

The US electric grid was built around a combination of baseload, load following and peaking generating plants. The US nuclear generating fleet has been used primarily for baseload service because the plants were reliable, and their design was not well suited to load following. The US coal generation fleet was used for both baseload and load following service. Oil and, later, natural gas simple cycle turbines were used for peaking service because they could be brought online quickly and could respond rapidly to changing demand. Hydroelectric generation, where available, was operated primarily as baseload generation because of its low cost. The introduction of natural gas combined cycle powerplants initially replaced simple cycle turbines because of their higher efficiency and operating flexibility. Later, they began to replace coal generators because of their higher efficiency and cleaner operation.

Concerns regarding climate change, the availability of various federal and state incentives, and the availability of lower cost wind and solar generators of improved design led to the introduction of these generating technologies into the US electric generating mix. However, both wind and solar differ in fundamentally important ways from conventional nuclear and fossil generation. Neither can be relied upon to be available when required and neither can be dispatched. They offer essentially “source of opportunity power”, available to be used when the wind blows and the sun shines. As wind and solar have entered the market, their “source of opportunity power” has been backed up by coal, natural gas and hydroelectric generation.

As the installed wind and solar generating capacity increases, the requirement for conventional backup also increases since the unavailability of wind and sun results in the loss of greater total generating capacity. This arrangement has worked reasonably well early in the intended transition to renewable generation. However, the expressed intent of the government is to eliminate the coal and natural gas generation which formed the backbone of the US generation fleet. This would also eliminate the ability to use fossil generation resources to provide backup power when the wind and solar generation resources are inadequate because of low wind conditions, cloudiness and darkness.

In the absence of dispatchable backup generation resources, the source of backup must transition to energy storage. Because of topography and environmentalist resistance to pumped hydro storage, the primary storage technology will likely be storage batteries. The storage battery capacity must be large enough to store all of the electric energy which would be expected to be needed during the longest period of low/no wind and solar availability which might be expected to occur. That also means that the wind and solar generating capacity must be large enough to serve almost all of the customer load when they are in operation, plus produce the additional electricity required to charge the storage batteries for use in periods of low/no wind and solar availability, and to recharge them afterwards.

Recent experience in the UK demonstrates that “wind droughts” can persist for weeks. In the current situation, the UK is able to draw power from the EU grid, supplied by nuclear, coal and natural gas generation. However, as the share of wind and solar generation increases and these conventional generating resources are eliminated, massive grid-scale storage facilities will be required to store the required electric energy and the capacity of wind and solar generation will be required to increase to charge the storage batteries. Prudence would also require the installation of both reserve generation and storage capacity to compensate for equipment maintenance and repair requirements.

The resolution of these issues is neither “blowin’ in the wind” nor basking in the sun. They must be resolved to avoid populations “freezing in the dark”.


Tags: Electric Power Reliability, Energy Storage / Batteries

Highlighted Article: Here is The Hidden $150 Trillion Agenda Behind The "Crusade" Against Climate Change


From: Zero Hedge

By: Tyler Durden

Date: October 14, 2021


Here is The Hidden $150 Trillion Agenda Behind The "Crusade" Against Climate Change


"We now live in a world, where bizarro headlines such as the ones below, have become a daily if not hourly occurrence:

*TREASURY TO STUDY IMPACT OF CLIMATE ON HOUSEHOLDS, COMMUNITIES
*TREASURY LAUNCHES EFFORT ON CLIMATE-RELATED FINANCIAL RISKS
*BRAINARD: CLIMATE-SCENARIO ANALYSIS WILL HELP IDENTIFY RISKS
*BRAINARD: CLIMATE CHANGE COULD HAVE PROFOUND ECONOMIC EFFECTS
*MESTER: FED LOOKS AT CLIMATE CHANGE FROM VIEW OF RISKS TO BANKS
*FED IS TAKING THE RIGHT COURSE ON MONITORING CLIMATE CHANGE
*FED SHOULD CONSIDER CLIMATE-CHANGE RISK TO FINANCIAL SYSTEM

Now, in case someone is still confused, none of these institutions, and not a single of the erudite officials running them, give a rat's ass about the climate, about climate change risks, or about the fate of future generations of Americans (and certainly not about the rising water level sweeping away their massive waterfront mansions): if they did, total US debt and underfunded liabilities wouldn't be just shy of $160 trillion." ...


Here is The Hidden $150 Trillion Agenda Behind The "Crusade" Against Climate Change


Tags: Highlighted Article

Climate Model Musings


Much has been written about the tendency of current climate models to overestimate recent warming and thus their unfitness to accurately project future warming. The graphs below, prepared by Dr. John Christy, illustrate this tendency for the CMIP5 and CMIP6 model ensembles.


5 Year Running Mean of Tropical Temperature CMIP5 Anomalies


5-yr Running mean 300-200hPa Tropical Temperature Anomalies CMIP-6


Two points are obvious from these graphs. First, the large number of models produce very significantly varying future projections among themselves. Second, all but one of the models produce individual projections widely at variance from observations over the period. As Dr. Christy notes on the first graph above, “the models and observations are not from the same physical system”. Since the observations, though “adjusted”, are from the physical system we call earth, we can consider them to be near-real. This leads to the obvious conclusion that the model projections are not “real” for the physical system we call earth.

The “adjustments” to the near-surface temperature have characteristically reduced the measured temperatures, as shown in this blink comparator prepared by Tony Heller. This blink comparator deals only with the US, but clearly illustrates the reductions to historical raw data. This illustration shows increases to recent data, though that is now far less common as the result of the US Climate Reference Network. The US CRN produces data there is no reason to “adjust”, which makes “adjusting” other US temperature more problematic.

The history of negative “adjustments” to historical near-surface temperature data might represent a possible explanation for the tendency of climate models to over-project future temperatures. The climate models are typically “tuned” to historical temperatures through hindcasting. This also assures that there are no glaring errors in the function of the models. However, this “tuning” is done to “adjusted” temperature histories in which older temperatures have been reduced, resulting in a steeper temperature increase trend over the period of the temperature record. Therefore, the “tuned” models are tested against a temperature record which shows an artificially rapid increase in historical temperatures. The “tuned” models would then be expected to project an artificially rapid future increase in temperatures as an extension of the “adjusted” historical trend.

The CMIP5 models have progressively falsified themselves; that is: “The hypothesis failed.” The CMIP6 models also appear to be in the process of falsifying themselves. Both model ensembles projected future temperature increases over the 1979-2020 period approximately three times the observed temperature increases. They clearly do not form an acceptable basis upon which to dramatically revise the energy and economic structures of the nations of the globe at the cost of trillions of dollars.

The model projections are the sole basis for the concerns regarding a “climate crisis”, “climate emergency” or “existential threat” resulting from continued emissions of “greenhouse gases” resulting from human activity. The consensed climate science community has acknowledged that the models are “running hot”, that the situation is unacceptable and unsustainable, and that it must be addressed. The consensed climate science community has also acknowledged the need to establish a more accurate global near-surface temperature measurement network, similar to the US CRN.

It is long past time to end the climate science practice of Frantic Researchers Adjusting Unsuitable Data.


Tags: Climate Models

Highlighted Article: IPCC AR6: Breaking the hegemony of global climate models


From: Climate Etc.

By: Judith Curry

Date: October 6, 2021


IPCC AR6: Breaking the hegemony of global climate models


"A rather astonishing conclusion drawn from reading the fine print of the IPCC AR6 WG1 Report.

Well, I’ve been reading the fine print of the IPCC AR6 WG1 Report. The authors are to be congratulated for preparing a document that is vastly more intellectually sophisticated than its recent predecessors. Topics like ‘deep uncertainty,’ model ‘fitness-for-purpose’ (common topics at Climate Etc.) actually get significant mention in the AR6. Further, natural internal variability receives a lot of attention, volcanoes a fair amount of attention (solar not so much).

If we harken back to the IPCC AR4 (2007), global climate models ruled, as exemplified by this quote:

“There is considerable confidence that climate models provide credible quantitative estimates of future climate change, particularly at continental scales and above.”

The IPCC AR4 determined its likely range of climate sensitivity values almost exclusively from climate model simulations. And its 21st century projections were determined directly from ..."


IPCC AR6: Breaking the hegemony of global climate models


Tags: Highlighted Article

Blame Game

“Government is like a baby. An alimentary canal with an appetite at one end and no sense of responsibility at the other.”, Ronald Reagan

The utility industry challenges discussed in the previous commentary, Reliability Roulette, have already begun to manifest themselves in service interruptions, first in California and most recently in Texas. In both cases, the blame game began immediately, based largely on impressions, limited information and CYA. The stage is already being set for more of the same.

The renewable energy industries assert that there are large backlogs of renewable energy projects currently being delayed by regulatory approvals, financial uncertainty and issues with transmission access. While these issues are not new, they have become more visible and more contentious with the establishment of the Administration wish to transition the electric industry to net zero emissions by 2035. While government is demanding this massive change in the electric utility industry’s supply portfolio, it accepts no responsibility for the impediments it places in the industry’s path.

The renewable energy industries are taking much the same position as the government regarding the required transition. Generators seeking to sell power to the electric grid have historically constructed their facilities in relatively close proximity to utility transmission facilities and provided the facilities necessary to make the grid connection. However, renewable generators frequently do not have the flexibility to locate facilities with convenient access to the grid. They currently take the position that it is the responsibility of the grid operators to extend the grid to their facilities. This has the added benefit of transferring the investment required to connect to the grid from the renewable generator to the grid operator, reducing the overall investment in the renewable generating facility and lowering the cost of the power generated.

The addition of intermittent, non-dispatchable generation to the transmission grid in growing quantities and the consequent displacement of dispatchable generating capacity produces the need to store excess renewable power, when available, to meet customer demand when intermittent power is not available in sufficient quantity. The renewable energy industries are taking the position that the construction and operation of grid-scale energy storage facilities, required only by the intermittency of their generation, is nonetheless the responsibility of the grid operators. This further reduces the apparent cost of the renewable generation, while transferring intermittency related costs to the grid operators.

As increased renewable generation replaces dispatchable generation, it produces a dead weight loss of the investment in the dispatchable facilities while creating a demand for increased grid-scale storage. Remaining dispatchable generators are operated less frequently, increasing the cost of the power they provide.

This situation positions the renewable energy industries, which rely on federal and state subsidies, incentives and generation preferences, to tout their low cost while blaming government for regulatory delays and the grid operators for problems with grid access, grid adequacy and grid-scale storage adequacy as well as the rising cost of electricity despite the lower cost of their renewable electricity.

Of course, any similarity to the baby described by former President Reagan above is purely coincidental.


Tags: Renewable Energy, Electric Power Generation

Highlighted Article: The Greenhouse Effect, A Summary of Wijngaarden and Happer


From: Watts Up With That

By: Andy May

Date: September 21, 2021


The Greenhouse Effect, A Summary of Wijngaarden and Happer


"The phrase “greenhouse effect,” often abbreviated as “GHE,” is very ambiguous. It applies to Earth’s surface temperature, and has never been observed or measured, only modeled. To make matters worse, it has numerous possible components, and the relative contributions of the possible components are unknown. Basic physics suggests that Earth’s surface is warmer than it would be with a transparent atmosphere, that is no greenhouse gases (GHGs), clouds, or oceans. If we assume Earth is a blackbody, then subtract the solar energy reflected, from the hypothetically non-existent clouds, atmosphere, land, ice, and oceans; we can calculate a surface temperature of 254K or -19°C. The actual average temperature today is about 288.7K or roughly 15.5°C. This modeled difference of 35°C is often called the overall greenhouse effect.

A blackbody is usually defined as a perfectly black cavity kept at a constant temperature. All energy that enters the cavity is absorbed by the cavity walls, and they emit exactly the same amount of energy, but the wavelength of the emitted radiation is not the same as the energy captured. Instead, the emitted radiation has a wavelength determined by the cavity temperature, which is held constant. The Earth is nothing like this. It isn’t black and both the atmosphere and the oceans absorb and redistribute solar energy, often the absorbed energy is circulated for a long time, even centuries or millennia, before it is reemitted. A blackbody absorbs and reemits energy with a delay of less than a second. Earth’s surface temperature is not constant, like a blackbody’s temperature, it varies a lot by latitude, altitude, season, and/or ocean depth. The Moon has a calculated blackbody temperature of 270K, no atmosphere or oceans, and an average temperature, at the equator and low latitudes, of around 215K, so even the" ...


The Greenhouse Effect, A Summary of Wijngaarden and Happer


Tags: Highlighted Article

Reliability Roulette

Service reliability has been a hallmark of the utility industry, which has made massive investments to assure reliable service. High reliability is important to the utilities’ customers and is demanded by utilities’ regulators. However, there is continuous tension among utilities, regulators and customers regarding the nature and scope of facilities investments required to assure adequate supply and  acceptable reliability while controlling costs and rates.

The electric utility industry has approached reliability by installing numbers of high reliability, high availability, dispatchable fossil fuel and nuclear generating stations, while taking advantage of available hydroelectric generation. Reliability was further enhanced by the establishment of regional transmission organizations which could move power among the member utilities. Market growth was accommodated by adding generators and transmission capacity. Response to changing demand was accomplished by adjusting the number and type of generators in service, the outputs of the individual generators and by allowing system voltage to vary within narrow limits. Storage was limited to hydroelectric generation, including pumped storage facilities.

The natural gas industry approached reliability by acquiring gas from numerous geographically and geologically spaced wells and moving the gas to market through numerous pipelines. Response to changing demand was accomplished through wellhead flow management, pipeline compressor control and near-market and in-market storage in abandoned gas wells and above ground gas holders.

Both industries have also implemented various approaches to demand management, including contractual service interruption or reduction in exchange for reduced rates. These approaches have worked well over numerous decades. However, both industries are now being challenged by federal and state actions in response to the perceived threat of climate change.

The electric industry is being required to acquire increasing quantities of energy from intermittent sources of renewable energy, primarily wind and solar energy. These intermittent renewable energy sources are not reliably available and are not dispatchable under utility or RTO control. Regulations also frequently require the utilities to accept all electricity generated by these renewable facilities when it is available while adjusting the operation of dispatchable generators to meet the balance of demand. The challenge of managing the grid increases as the percentage of intermittent renewable generation increases, since the intermittent generator output can fluctuate rapidly and increasing dispatchable generation must be available to meet demand.

The natural gas industry is facing federal and state restrictions on exploration for and production of additional sources of supply. The hydraulic fracturing technology which has greatly expanded natural gas availability and reduced prices is being challenged by environmentalists. The continuing and expanded use of natural gas is also being challenged since its combustion produces CO2, which is viewed as a contributing cause of climate change.

Both utility industries are also being challenged by environmentalist opposition to the construction of new transmission capacity to move energy to growing markets.

These issues are adversely affecting the ability of both electric and gas utilities to assure reliable service at reasonable cost and are thus in conflict with the demands of both regulators and customers.


Tags: Electric Power Reliability, Electric Power Generation

Highlighted Article: A Coal Exit Treaty Can Radically Simplify and Accelerate Climate Policy


From: The Honest Broker Newsletter

By: Roger Pielke Jr.

Date: September 20, 2021


A Coal Exit Treaty Can Radically Simplify and Accelerate Climate Policy


"A focus on eliminating coal power offers a much more pragmatic approach to deep decarbonization

While there are encouraging signs that the global emissions of carbon dioxide have plateaued, achieving deep decarbonization of the global economy remains a massive challenge. In this post I’ll propose a complementary approach to climate policy that is far more pragmatic than the current architecture of global climate policy.

For decades, climate policy has focused on managing outcomes, which at various times have included the atmospheric concentration of greenhouse gases and more recently, global average surface temperatures. Such outcomes are useful for setting goals – like the well-known 2 degree Celsius temperature target -- but are poor choices for management, because such outcomes can only be indirectly managed. Policy typically works better when focused on managing causes rather than consequences.

Climate policy, broadly conceived, includes an incredible array of issues touching upon just about every facet of policy making, but here I focus on a narrow but important element of climate policy, the emission of carbon dioxide from the burning of fossil fuels. Here the math is incredibly simple: if the temperature targets of the Paris agreement are to be reached, then carbon dioxide emissions from the burning of fossil fuels necessarily ..."


A Coal Exit Treaty Can Radically Simplify and Accelerate Climate Policy


Tags: Highlighted Article

Natural Variation

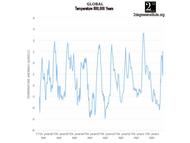
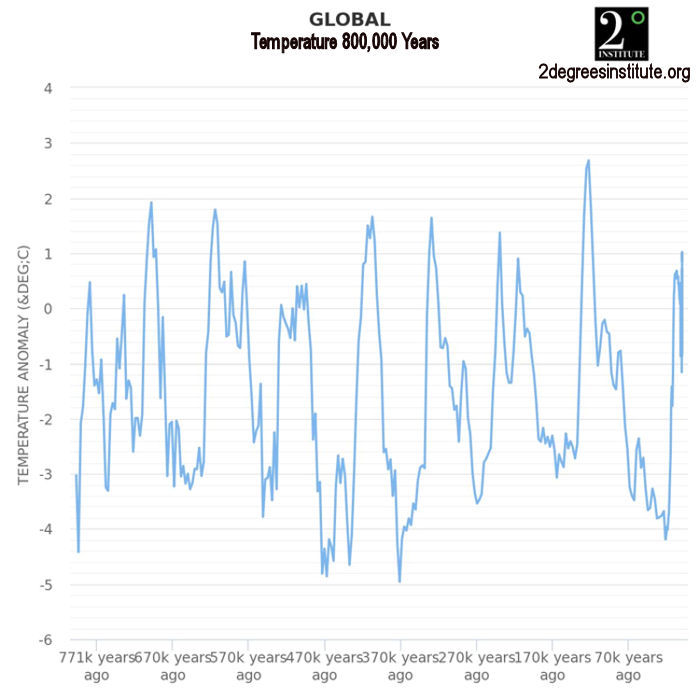
The earth has experienced roughly cyclical warming and cooling periods over at least the past 800,000 years, accompanied by roughly cyclical increases and decreases in atmospheric CO2. The positive temperature anomalies over this period have ranged from approximately +0.3 to +2.7°C, while the negative temperature anomalies have ranged from approximately -3 to -5°C. The lowest negative temperature anomaly in recent times was approximately -1.2°C in 1579, during the Little Ice Age. The current temperature anomaly is approximately 0.92°C, calculated in July 2021. Atmospheric CO2 concentrations have ranged from approximately 177 ppmv to the recent approximately 420 ppmv. Graphical presentations of this information can be viewed at the linked site by clicking on the icons at the upper left-hand corner of the graph. The darker lines on the 1000-year graphs represent the instrumental data period.

The shorter-term graphs do not show the Roman Warm Period, the Medieval Warm Period or the Little Ice Age as clearly as some other sources. While the graphs in the longer term reference above show a total temperature range of approximately 4°C over the past 800,000 years, the graph in the second reference shows a total temperature range of approximately 2°C over the past 4,500 years. This graph provides a clearer comparison of recent warm and cool periods including the modern warming period.

There was extensive discussion within the consensed climate science community approximately 10 years ago regarding the inconvenience of the Roman and Medieval warm periods, which could not be explained as being the result of increased atmospheric CO2 concentrations resulting from anthropogenic emissions, There was discussion of the advantages of “disappearing” these warm periods. There has recently been discussion in the consensed climate science community about the end of natural variation, suggesting that all recent changes in climate are the result of anthropogenic CO2 emissions.

However, there is no scientific basis for suggesting that the roughly cyclical pattern of global temperature change over the past 800,000 years has ceased, and that all temperature change over the past 70, or even 140, years has been the result of anthropogenic GHG emissions. There is no question that anthropogenic GHG emissions have occurred and that they have had some effect on global temperatures. However, there is also no scientific basis on which to assert that anthropogenic emissions are totally, or even primarily, responsible for increasing global temperatures. There is also no scientific basis upon which to allocate the anthropogenic influence on increased global temperatures among GHG emissions, land use changes and the Urban Heat Island effect on temperature measurements.

There is also little or no evidence that anthropogenic influence on climate has had any adverse impact on the frequency or intensity of weather events such as tropical cyclones, tornadoes, droughts, floods, heat and cold waves, wildfires, etc. However, there is evidence that increased atmospheric CO2 has had a dramatic positive impact on global greening, as well as a positive impact on the efficiency with which many common plant species use available water resources.


Tags: CO2 Emissions, Natural Variability, Temperature Record

Highlighted Article: 15 minutes


From: Climate Etc.

By: Judith Curry

Date: September 3, 2021


15 minutes


"In a recent invited talk at the American Chemical Society annual meeting, I attempted to explain the climate debate in 15 minutes.

This talk was given in a session on sustainability. Other invited speakers included James Green (NASA Chief Scientist), Marilyn Brown (Georgia Tech) . Our talks were followed by a panel discussion. This was an extremely interesting session, but was not recorded owing to an ACS glitch (you can read the abstracts at the link above)." ...


15 minutes


Tags: Highlighted Article

Pieces of a Plan

"A goal without a plan is just a wish." – Antoine de Saint-Exupéry

The Biden Administration has yet to release a plan to reach its stated CO2 emission reduction goals for 2030, 2035 and 2050. However, the Administration has taken several apparently disjointed actions which provide some hint of what the plan will involve. These actions present the potential of a very inconvenient and dangerous energy future for the US.

Intermittent renewable generation provided approximately 10.7% of US electricity generated for all uses in 2020. The Administration’s stated goal is to achieve 100% clean electricity by 2035, or within 13.3 years. The US currently has 1,117,475 MW of generating capacity, of which 66%, or 737,534 MW is fossil fueled and would need to be replaced by clean generators, primarily wind and solar. Assuming that the current shares of solar (~20%) and wind (~80%) continue into the future, total new intermittent renewable generating capacity of approximately 2,000,000 MW would be required to replace the entire fossil fuel generating fleet.

Wind turbines would constitute approximately 80% of the new generating capacity, requiring installation of 1,475,000 MW of wind turbine generating capacity. This would require production and installation of approximately 500,000 onshore 2 MW wind turbines, approximately 100,000 offshore 14 MW wind turbines, or some combination thereof. Solar PV collectors would constitute approximately 20% of the new generating capacity, requiring installation of approximately 590,000 MW of solar generating capacity, or approximately 1,475,000,000 solar collectors of 400W capacity. Note that these calculations are based on current electricity demand and consumption and make no allowances for the additional demand and consumption which would result from conversion to electric vehicles and the replacement of residential and commercial natural gas, propane and oil fueled appliances and equipment, most of which would likely occur after 2035.

The Administration has proclaimed that this transition would result in creation of millions of high paying union jobs, which implies that the production of the wind turbines and solar collectors would occur in the US. This would require preparation of numerous environmental impact statements by potential generation developers, review and approval of those impact statements by federal and state regulators and the issuance of building permits by federal and state authorities. This is currently a long, difficult and expensive process which could extend to, and likely beyond, 2025. This would also require the design, construction and commissioning of manufacturing facilities for the wind turbines and solar collectors, which could also extend to, and likely beyond, 2025.

Assuming such a schedule, achieving the Administration goal of 100% clean electricity by 2035 would require production and installation of approximately 100 wind turbines and approximately 400,000 solar collector panels per day. Also, each MW of generating capacity would require installation of 2-4 MW of grid-scale storage capacity to support the grid during multi-day periods of little or no generation due to weather conditions.

The scale of this effort might require the return of “Rosie the Riveter”. However, at this time, it all remains a wish.


Tags: CO2 Emissions, Renewable Energy, Wind Energy, Solar Energy

Highlighted Article: Climate Hype Hurts the Environment and Undermines Our Society


From: Cliff Mass Weather Blog

Date: August 17, 2021


Climate Hype Hurts the Environment and Undermines Our Society


"Climate hype is profoundly damaging the environment and society; the evidence for this is compelling and discussed in this blog.

I have always been an environmentalist, worried about the protection of our natural environment. And I am concerned about global warming and its effects on humanity and the health of the planet.

Thus, I have become increasingly apprehensive about apocalyptic climate change hype, which is profoundly damaging the environment of our region and undermining the well-being of many.


Damage to the Northwest Environment from Climate Change Hype

There is substantial damage being done to the Northwest environment from the unfounded hype found in the media, some politicians, and several activist groups.  Consider a few examples:

Wildfires and Lack of Forest Management.  

Prominent politicians in our state and some media/activist groups have stated that climate change (a term used to mean human-caused global warming) is the predominant cause of the increase in regional fires and smoke.  

This is simply not true.  Regional forest experts (e.g., here and here) are emphatic that the key problems are unhealthy dry side forests, overgrown and explosive after decades of fire suppression, the invasion of flammable invasive grasses, and increasing fire ignitions by the rapidly growing population of our region.   Some knowledgeable local environmental leaders (e.g., Public Lands Commissioner Hilary Franz) have said the same thing." ...


Climate Hype Hurts the Environment and Undermines Our Society


Tags: Highlighted Article

IPCC Confidence Game

Definition of confidence (Entry 1 of 2)

: a feeling or consciousness of one's powers or of reliance on one's circumstances

Definition of confidence (Entry 2 of 2)

: of, relating to, or adept at swindling by false promises

IPCC Guidance regarding confidence

A level of confidence is expressed using five qualifiers:
“very low,” “low,” “medium,” “high,” and “very high.” It
synthesizes the author teams’ judgments about the validity
of findings as determined through evaluation of evidence
and agreement. Figure 1 depicts summary statements
for evidence and agreement and their relationship to
confidence.

The IPCC AR6 Summary for Policymakers begins with the following Headline Statement:

It is unequivocal that human influence has warmed the atmosphere, ocean and land. Widespread and rapid changes in the atmosphere, ocean, cryosphere and biosphere have occurred.


This “unequivocal” statement is very carefully worded, as is the entire Summary for Policymakers. The specific human influences are not listed, nor are their relative contributions identified. The specific changes in the “atmosphere, ocean, cryosphere and biosphere” are also not listed, nor are they asserted to be “unequivocal”.

There is little doubt that increasing global population, clearing of forest land for cultivation, construction and expansion of cities, roads and highways and emissions of greenhouse gases cause warming of the local and regional climate and that the accumulation of this local and regional warming has warmed earth’s atmosphere. However, there is also little doubt that the natural variation in earth’s climate continues as well. It is not currently possible to separate the effects of human influence from the effects of natural variability.

The graph below prepared by Dr. Roy Spencer displays the entire history of satellite atmospheric temperature measurement. Even if one assumes that the increase in atmospheric temperature over the period is the result of human influence, the very rapid changes of atmospheric temperature above and below the trend line are clear and unequivocal evidence of the existence of natural variation, driven largely by ENSO events.


UAH Satellite Temperature 08-2021


The graph below illustrates the evolution of IPCC “confidence” and “likelihood” assessments regarding CMIP5 climate model projections and contrasts them with the growing gap between the climate model projections and observations of both near-surface (adjusted) and satellite temperature.


climate model projections and observations


The graph below by Dr. John Christy illustrates that the difference between model projections of temperature and observed temperature continues to grow in the CMIP6 model ensemble, while IPCC confidence in the likelihood of the model projections eventuating remains very high.


difference between model projections of temperature and observed temperature


Dr. Christy concluded that the hypothesis embodied in the CMIP5 model ensemble had failed.


It appears clear that the hypothesis embodied in the CMIP6 models also fails, despite the IPCC’s apparent high confidence.

The IPCC guidance regarding confidence printed above speaks to evaluation of evidence and agreement. The observation trend shown in green above, while tainted by “adjustment”, is evidence of the warming global atmosphere. The model trend average shown in red above is representative of “agreement” by the IPCC parties, but is evidence that the models do not model the real atmosphere.


Tags: IPCC, Climate Models

Highlighted Article: Extreme Fraud At NOAA


From: Real Climate Science

By: Tony Heller

Date: August 1, 2021


Extreme Fraud At NOAA


"NOAA’s Climate Extremes Index shows summer afternoon temperatures much above normal are affecting more and more of the US, with the past decade was highest on record.


Contiguous U.S. Extremes in Maximum Temperature


They show an upwards trend beginning around fifty years ago.


U.S. Climate Extremes Index (CEI) | Extremes | National Centers for Environmental Information (NCEI)


"But their thermometer data shows the exact opposite, as does the National Climate Assessment. There are 1,218 stations in the United States Historical Climatology Network." ...


Extreme Fraud At NOAA


Tags: Highlighted Article

Propaganda

“A society, most of whose members spend a great portion of their time, not on the spot, not here and now and in the calculable future, but somewhere else, in the irrelevant worlds of sport and soap opera, of mythology and metaphysical fantasy, will find it hard to resist the encroachments of those who would manipulate and control it.”


“In their propaganda today’s dictators rely for the most part on repetition, suppression and rationalization – the repetition of catchwords which they wish to be accepted as true, the suppression of facts they wish to be ignored, the arousal and rationalization of passions which may be used in the interests of the Party or the State. As the art and science of manipulation come to be better understood, the dictators of the future will doubtless learn to combine these techniques with the non-stop distractions which, in the West, are now threatening to drown in a sea of irrelevance the rational propaganda essential to the maintenance of individual liberty and the survival of democratic institutions.”

Brave New World Revisited, Aldous Huxley

Aldous Huxley’s first paragraph above accurately describes a large portion of the population of the developed nations, distracted in their leisure by sports, television programs, computer games and fantasy roleplay.

The second paragraph above, while mentioning “dictators”, clearly describes the governing approach of many world ‘leaders”, both the elected heads of national governments and the would-be leaders of an aspirational global government and their bureaucratic hangers-on.

The subject of climate change provides excellent examples. The repetition of catchphrases such as “climate crisis”, “climate emergency” and “existential threat” is an attempt to create the impression in the populace that climate change is an urgent problem that must be dealt with quickly and aggressively. However, these are the terms of political science, not the hard science of climate change. The leaders using these terms know that the populace at large is too distracted to search beyond the hype and study the underlying science. The leaders are frequently the source of other distractions intended to distract the public from the issue.

The Climategate e-mails reveal a history of suppression of scientific results which differ from the accepted consensus narrative and dissenting opinions regarding the significance of CO2 and other GHG emissions on future climate. They also reveal a history of attempts to vilify and delegitimize scientists whose work differs from the consensus positions.

Government funding of studies intended to produce scary scenarios are an effort to arouse the public regarding climate change and to encourage them to demand a government response. The involvement of loud advocates for action, such as Grata Thunberg, and of numerous members of the industries which provide the public with irrelevant distractions contribute to public arousal and demands for action.

The global media have move well beyond reporting and have become advocates for action on climate change, supporting and promoting the consensus narrative. They are willing and uncritical participants in politicians’ efforts to move the public to demand action, while ignoring the potential impacts of government actions on the economy and the population’s lifestyles.

Scientists and others who question the consensus narrative are pounced upon by “factcheckers”, who are not really checking factual accuracy but rather consensus adherence. However, these same “factcheckers” completely ignore the history of failed predictions of imminent climate catastrophe made by climate alarmists.


Tags:
Search Older Blog Posts