The United States has still not terminated its participation in the United Nations Framework Convention on Climate Change (UNFCCC), as required by current US law, as the result of the UNFCCC granting state-level recognition to the Palestinian Authority. This action would also hasten the official US withdrawal from the Paris Accords.
The US announced that it would make no further contributions to the UN Green Climate Fund (GCF). Most other nations are not meeting their commitments to the Fund. The GCF is struggling to justify its existing project funding commitments while seeking additional funding for projects currently proposed.
The Intergovernmental Panel on Climate Change (IPCC) has issued its Special Report (SR15) on the challenges of limiting the increase in global temperature anomalies from exceeding 1.5°C. The US has not officially reacted to the new report, which was prepared in anticipation of Conference of the Parties (COP) 24 in Katowice, Poland. The IPCC continues to ignore research which does not support the catastrophic anthropogenic global warming narrative.
The Administration has not formally begun an effort to vacate the 2009 EPA Endangerment Finding, though it is becoming increasingly obvious that the Endangerment Finding was based on incomplete and faulty data.
US EPA has proposed the Affordable Clean Energy Plan as a replacement for the Clean Power Plan, which has been stayed by the US Supreme Court. The proposed plan would provide additional flexibility for the operators of existing coal-fueled electric generating facilities and for the construction of new coal facilities.
National Highway Traffic Safety Administration (NHTSA) and US EPA have proposed the Safer Affordable Fuel Efficient (SAFE) Vehicle Rules to replace the much stricter CAFÉ standards put in place by the Obama Administration.
US EPA has proposed terminating the use of “Secret Science” in developing and supporting proposed rulemaking. There has been significant pushback from scientists, mostly expressing concern with divulging personal information about study participants. However, there is no question that such personal data could be withheld, while still permitting the study design, conduct and analysis to be scrutinized.
US EPA has substantially revised participation in its Science Advisory Board, eliminating members who also performed contract research and consulting services for the Agency, which was clearly a potential / actual conflict of interest. EPA has also increased the participation of industry scientists in the Board.
The Administration has revised the estimates of the Social Cost of Carbon (SCC), though the issue of the benefits of higher atmospheric CO2 concentrations has yet to be addressed as part of the revision process. The largest impact on the SCC was the application of more typical discount factors in the calculation of future costs.
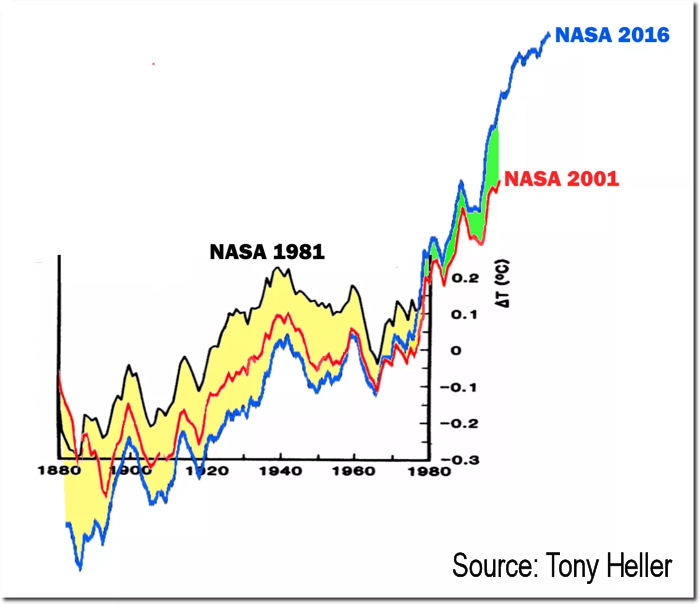
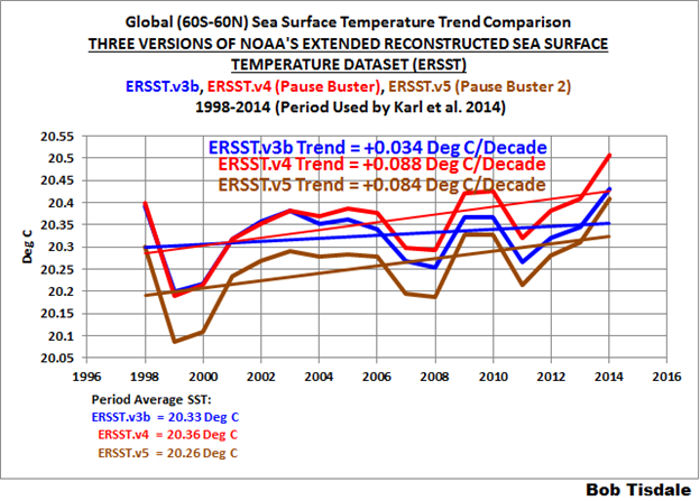
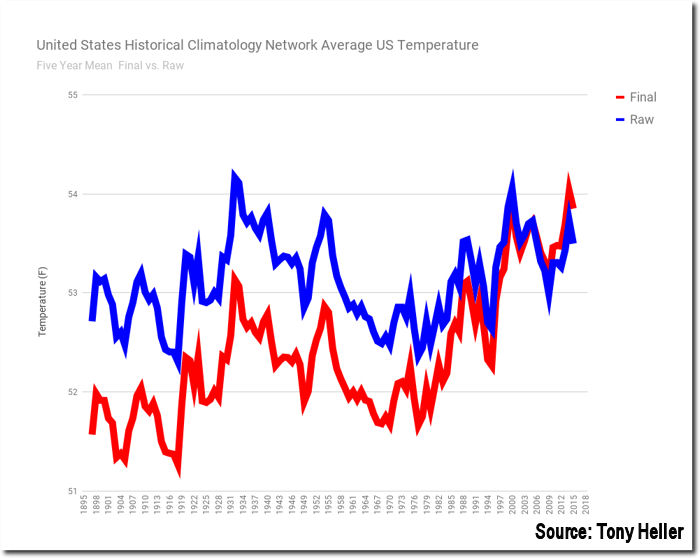
Elements of the consensed climate science community have begun to acknowledge the limitations of the existing near-surface temperature anomaly data; and, they have recommended establishment of a “global land surface climate fiducial reference measurements network”, similar to the US Climate Reference Network This network would provide accurate global near-surface temperature measurements, eliminating the “need” for repeated data “adjustment” and “reanalysis”.
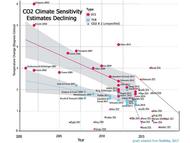
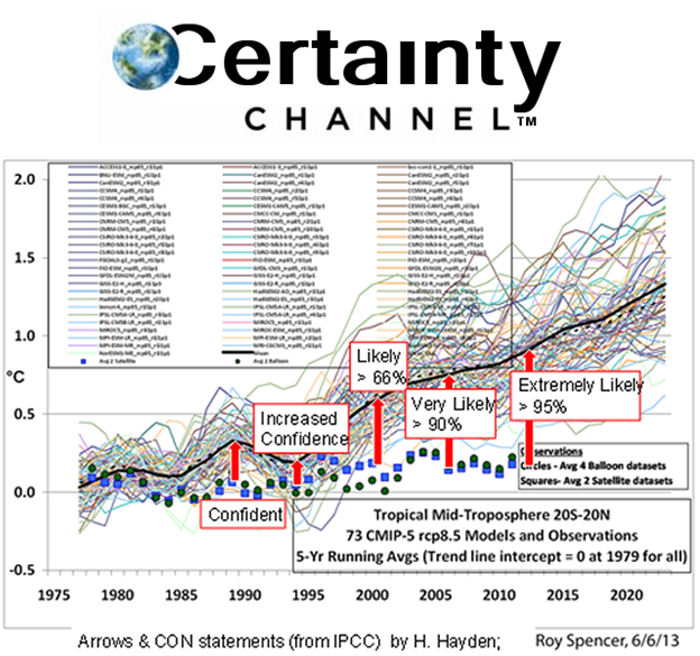
Elements of the consensed climate science community have acknowledged that the existing ensemble of climate models is “running hot”, significantly over-projecting temperature anomaly increases. This issue is apparently driven by high climate sensitivity estimates, uncertain forcing and feedback estimates and unrepresentative Representative Concentration Pathways.
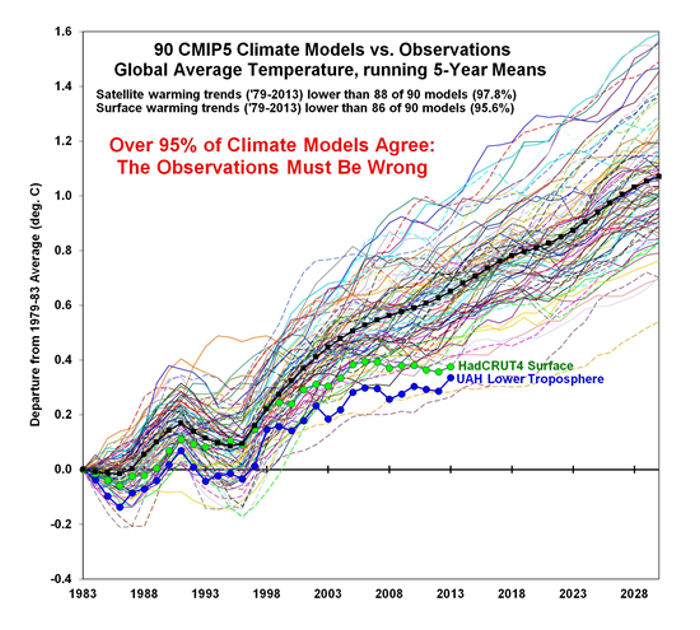
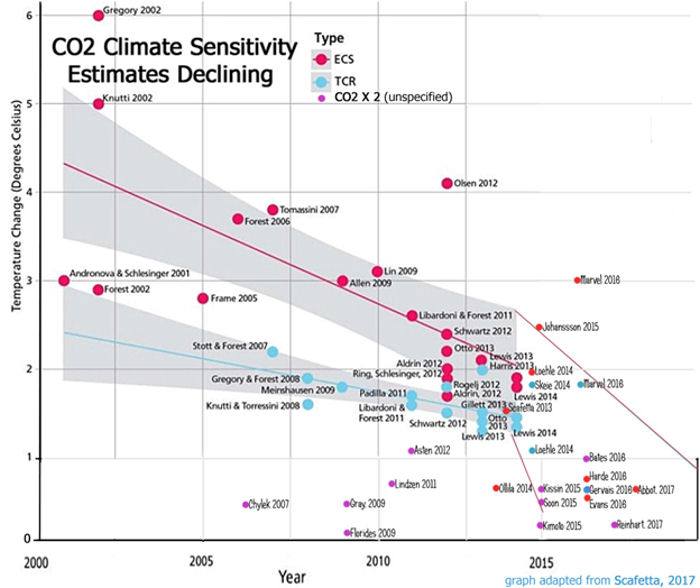
Recent research continues to suggest climate sensitivity at or below the low end of the sensitivity estimates used by the IPCC. Lower sensitivity, combined with the logarithmic nature of the effect of additional atmospheric CO2 concentrations, would lead to smaller future increases in global temperature anomalies.
The temperature anomaly trend has continued to decline in the wake of the 2015/2016 super El Nino, further increasing the disparity between the temperature anomaly observations and the modeled projections.
Examination of extreme weather trends reveals that major US landfalling hurricanes and US tornado activity have declined, global drought severity shows no significant trend, and the climate science community has little confidence that climate change is driving extreme weather.
NASA has documented the occurrence of global greening, largely as the result of increasing atmospheric CO2 concentrations. This greening has impacts on the growth of all types of plants, including the common food crops, increasing crop yields and food security.
Regardless of the US decision to withdraw from the Paris Accords, US CO2 emissions continue to decline, though not as rapidly as they would have had to decrease under the terms of the Accords.
The situations discussed above suggest continued progress on climate change issues in 2018. However, as indicated above, much remains to be done.


 The Right Insight is looking for writers who are qualified in our content areas. Learn More...