Call or complete the form to contact us for details and to book directly with us
435-425-3414
435-691-4384
888-854-5871 (Toll-free USA)


Contact Owner

*Name
*Email
Phone
Comment
 
Skip to Primary Navigation Skip to Primary Content Skip to Footer Navigation

In the Wake of the News

Toward A Vegan Future

One aspect of the Ultimate Goal of the Catastrophic Anthropogenic Global Warming movement is a global conversion to a vegan diet. The sustainability movement asserts that the growing global population is already stressing the available food supply; and, that reduction of the land area dedicated to grazing and growing grains to feed animals for both meat and milk production is essential to avoid mass food deprivation and, ultimately, starvation.

“Researchers from the Sustainability Research Institute at University of Leeds in England and the Mercator Research Institute on Global Commons and Climate Change in Berlin” assert that: “Right now, there's not a single country on Earth that provides its people a good, sustainable life.” Essentially, they conclude that those currently enjoying a “good life” are not doing so sustainably; and, that those currently living a sustainable life are not enjoying a “good life”. They suggest that, for all to live a good life sustainably, "we need to become two to six times more efficient at transforming resource use into human well-being." We would also need to massively redistribute wealth and income.

A global shift to veganism is unlikely to occur quickly or voluntarily. Despite concerns about existing stresses on the available food supply, meat consumption and dairy consumption continue to grow as nations become more prosperous. This has led researchers to focus on the various measures of the efficiency of land use for meat production and the efficiency of conversion of resources to edible meat protein. Beef is the least efficient in both land use and protein conversion efficiency, followed by lamb, pork and poultry. Beef production is also responsible for most of the greenhouse gas emissions associated with animal husbandry.

Politicians and environmental activists, always eager to maximize their contributions toward a sustainable future, have begun advocation for a meat tax. The environmental activists are concerned about land use, resource consumption and environmental emissions. The politicians envision another source of funding, since they have so far been unsuccessful in instituting a carbon tax. The meat tax would be a form of “sin tax”, intended ultimately to drive meat from the market. As with all “sin taxes”, the tax rate would be increased, as required, to maintain the revenue stream, until there was no meat left to tax.

Beef production has grown far less rapidly than poultry and pork production, likely because of the far greater land and feed requirements and the longer maturation period for beef cattle. Dairy milk production has remained relatively flat in recent years, while consumption of soy milk and nut and grain milks have increased.

Textured vegetable protein meat analogues have been available in the US market for at least 50 years, though their market penetration has been largely limited to those with religious and / or dietary constraints. However, major new public / private partnership efforts are underway in an attempt to increase the acceptability and acceptance of meat analogues as a climate-friendly alternative to commercial animal husbandry. The challenges of approximating taste, texture and chew have largely been overcome for fully cooked products. However, the challenge of successfully approximating the aesthetic qualities of a piece of medium rare beef steak, hamburger, leg of lamb, etc. remains.


Tags: Sustainability

Highlighted Article: Sea level rise acceleration (or not)

This is a multi-part series by Judith Curry posted on her blog, Climate Etc.

 “I have several clients that are interested in the issue of sea level rise, from a range of perspectives (insurance, engineers, city and regional planning, liability). I am preparing a comprehensive assessment of the topic, with a focus on sea level rise in the U.S. I will be posting draft chapters on the blog for you to critique. I am also hoping that crowdsourcing will help me identify additional resources and information.”


  1. Introduction and context
  2. The Geological Record
  3. 19th & 20th Century Observations
  4. Satellite Era Record
  5. Detection & Attribution
  6. Projections for the 21st Century


(updated 4/2/18 - added new chapter 6 link and corrrected chapter titles)


Tags: Highlighted Article

The UN Has a Better Idea for Combating Climate Change

The UN Habitat for a Better Urban Future convened the World Urban Forum (WUF9) in Malaysia in February 2018. The broad focus of the Forum is on “sustainable urbanization”. The document which provides the focus for this effort is the “Quito Declaration of the New Urban Agenda”.

The Committee for a Constructive Tomorrow (CFACT) sent a delegation to the UN Habitat III meeting in 2016, at which the Quito Declaration of the New Urban Agenda was developed and adopted. CFACT partially summarizes the contents of the Quito declaration as follows:

  • Regulating businesses to change their profit-motive operations to ones “based on the principles of environmental sustainability and inclusive prosperity …” (i.e. socialism)
  • A commitment to promote “international, national, sub-national, and local climate action … consistent with the goals of the Paris Agreement on climate change.”
  • Creating new rights to government housing and redistributed wealth.
  • The establishment of a “UN-Habitat multi trust fund … in support of sustainable urban development, to be accessed by developing countries.”
  • Expanding “sexual and reproductive health-care services.” (i.e., population control)
  • Using cities as a vehicle to transfer great wealth from tax and ratepayers to "green energy" corporations that make no meaningful difference to the climate.

While the US has been a party to these proceedings in the past, it appears unlikely that the current US Administration would be supportive of any of the objectives listed above. The Administration has focused on easing regulations on businesses. The US has begun withdrawal from the Paris Accords and is obligated by US law to withdraw from the UN Framework Convention on Climate Change. The Administration has shown no inclination to establish new “rights” to government housing or to redistributed wealth. The US has already ceased funding the UN Green Climate Fund and would appear unlikely to commit to funding a UN Habitat multi-trust fund. The Administration has also halted funding to the UN for “sexual and reproductive health-care services” through the UN Population Fund.

The previous US Administration might well have found such programs admirable, but the current Administration would likely find them anathema. The UN maintains its focus on the various aspects of global governance, though still using existing government structures as their vehicle. However, it is unlikely that this approach would achieve the objectives the UN has set, leading ultimately for a push toward global governance through the UN.

A recent study published in the journal Nature, “A Good Life for All Within Planetary Boundariesamplifies some of the issues regarding cities and sustainable development as follows:


"We apply a top-down approach that distributes shares of each planetary boundary among nations based on current population (a per capita biophysical boundary approach)...If all people are to lead a good life within planetary boundaries, then our results suggest that provisioning systems must be fundamentally restructured to enable basic needs to be met at a much lower level of resource use."


This is clearly an agenda of imposed socialism and should be anathema to all free people.


“Socialism is a philosophy of failure, the creed of ignorance, and the gospel of envy, its inherent virtue is the equal sharing of misery.” --Winston Churchill


Tags: United Nations, Sustainability

Highlighted Article: California v. The Oil Companies - The Skeptics Response

In the lawsuit between California and the big oil companies, the federal district court has asked for a tutorial on global warming and climate change. Here is the response from Professors William Happer, Steven E. Koonin, and Richard S. Lindzen. Also included is commentary from Marc Morano at Climate Depot.


ADMINISTRATIVE MOTION OF WILLIAM HAPPER, STEVEN E. KOONIN, AND RICHARD S. LINDZEN FOR LEAVE TO SUBMIT PRESENTATION IN RESPONSE TO THE COURT’S TUTORIAL QUESTIONS


‘Global warming’ on trial: Prominent scientists submit climate skeptics’ case to federal court – Climate Depot, Marc Morano


Tags: Highlighted Article

Natural vs. Unnatural Temperature Change

The graph below shows the satellite lower troposphere temperature anomaly from inception through January 2018, as prepared by Drs. Roy Spencer and John Christy of the University of Alabama – Huntsville (UAH).

UAH Satellite-Based Temperature Graph

The graph has been highlighted to illustrate the numerous instances of natural variation in the running average temperature anomaly record. The instances of natural variation in the monthly anomalies are both more numerous and more rapid than those shown in the running average. These instances of natural variation are larger and more rapid than the longer term positive variation in the anomaly record, some or all of which is alleged to be anthropogenic.

The graph below shows the NASA GISS near-surface temperature anomaly from inception through the end years shown for the three anomaly plots graphed. Note that the three anomaly plots shown in the graph are based on the same temperature data through 1981; and that the red and blue plots are based on the same data through 2001. Clearly, there are numerous incidences of natural variation evident in each of the three anomaly plots, although they do not appear to be as dramatic as in the graph above because of the longer time frame and larger anomaly range displayed.

The graph below displays two instances of unnatural variation in the anomaly record; that is, variation resulting from anthropogenic “adjustments” to, or “re-analysis” of, the global temperature record made by NASA GISS. The climate over the period from 1880 to 1980 and its actual anomaly from the reference period did not change. However, the reported anomaly over the period did change. The anomaly was reduced by as much as ~0.2oC early in the period, thus increasing the apparent rate of change of the anomaly over the period, as shown in the area highlighted in yellow in the graph. The climate over the period from 1980 to 2001 and its actual anomaly from the reference period also did not change. However, the reported anomaly over the period did change. The anomaly was increased by as much as 0.2oC late in the period, as shown in the area highlighted in green in the graph, again increasing the apparent rate of increase of the anomaly over the period. We cannot determine from the information in the graph the number of times the anomalies were “adjusted” or “re-analyzed”. We can only determine the cumulative effects of the “adjustments” or “re-analyses”, which appear to total ~0.4oC, or approximately 1/3 of the reported anomaly change over the entire 136 year period.

We do not know which, if any, of the anomaly plots contained in this graph is accurate. We do know, however, that they cannot all be accurate.

This issue would be far less significant if we were analyzing the results of a controlled experiment which could be rerun after recalibrating the temperature sensors to assure maximum accuracy. However, we are dealing with an ongoing, non-reproducible experiment. The issue would also be far less significant if the expenses of the experiment, or investments which might be made as a result of the experiment, were minimal. However, this ongoing experiment has involved expenses in the billions of dollars; and, the investments to be made as the result of the experiment would be in the tens of trillion of dollars and would affect the lives of billions of people.

This experiment is a vast program, which should not have been begun and should not be pursued with half-vast ideas. We continue to do so at our expense and at our peril.


Tags: Natural Variability

Highlighted Article: The Social Cost of Carbon

By: Reason Foundation - Julian Morris

CLIMATE CHANGE, CATASTROPHE, REGULATION AND THE SOCIAL COST OF CARBON

Executive Summary:

Federal agencies are required to calculate the costs and benefits of new regulations that have significant economic effects. Since a court ruling in 2008, agencies have included a measure of the cost of greenhouse gas emissions when evaluating regulations that affect such emissions. This measure is known as the “social cost of carbon” (SCC). Initially, different agencies applied different SCCs. To address this problem, the Office of Management and Budget and Council of Economic Advisors organized an Interagency Working Group (IWG) to develop a range of estimates of the SCC for use by all agencies. However, the IWG’s estimates were deeply flawed. In April 2017, President Trump issued an executive order rescinding the IWG’s estimates and disbanded the IWG. The question now is what value regulatory agencies should use for the SCC—if any—when evaluating rules that affect greenhouse gas emissions.

CLIMATE CHANGE, CATASTROPHE, REGULATION AND THE SOCIAL COST OF CARBON


Tags: Highlighted Article

Climate Change Humpty Dumptyism

“When I use a word, it means just what I choose it to mean—neither more nor less.”, Humpty Dumpty

Humpty Dumptyism: The practice of insisting that a word means whatever one wishes it to.

Fact: Something that has actual existence; an actual occurrence

Data: Factual information (such as measurements or statistics) used as a basis for reasoning, discussion, or calculation

I have previously written about facts in relation to global temperature measurements. Climate scientists recognize that not all of the data they collect are necessarily “facts”, because they have been collected at the wrong time, or are of questionable accuracy for other reasons. However, they are still data, in that they are measurements, even if they are known or suspected to be inaccurate, subject to the conditions surrounding their acquisition.

All of the data collected from measuring stations on a given day, or during a given month, constitute a dataset for that period. However, those datasets might not be complete, if data is not collected from all measurement sites for some reason. When a producer of temperature anomaly products selects data for analysis from a dataset, eliminating missing data, obvious data “outliers”, etc. they create a subset of the data which becomes their dataset for that period.

It is common practice among the producers of temperature anomaly products to “adjust” the data in their data sets to compensate for errors and suspected biases. In making these ‘adjustments”, their datasets become “estimate sets”, since the temperatures in the sets are no longer actual measurements. Rather, they are now estimates of what the data might have been if it had been collected timely from properly sited, calibrated, installed and maintained instruments. However, it is also common practice to continue to refer to these sets of temperatures as datasets.

NASA GISS typically “infills” their estimate sets with estimates of the likely temperatures in areas in which there are no measuring stations, or from which no data were collected for other reasons during the current period. It is typical to refer to the “infilled” estimate sets as datasets, despite the fact that most of the original data has been “adjusted” and missing data has been “infilled” with manufactured estimates.

The producers of the temperature anomaly products then compute a global average temperature value from their estimate sets for the period under analysis. This temperature value is then compared with the average estimated temperature value for the corresponding period (month or year) during a thirty-year reference period. The calculated temperature difference between the current period and the reference period is then recorded as the temperature anomaly estimate for the current period.

The “adjustments” made to the data prior to calculation of the anomaly for the period are the only “adjustments” made to the data. However, it is not uncommon for further adjustments to be made to the estimate sets over time, as discussed here and here. Again, it is certainly possible the estimate sets are accurate; and, that the subsequent anomaly calculations are also accurate at some point in the ongoing “adjustment” process. However, if that is the case, it would be very difficult to determine which of the “adjusted” values is accurate.


Tags: Adjusted Data, Estimates as Facts, Global Temperature, Temperature Record

Highlighted Article: Intimidating the “Deniers” to Enforce the “Consensus”

By: Marc Morano

This is a bonus chapter that was not included in Marc Morano's book - The Politically Incorrect Guide to Climate Change.

Intimidating the “Deniers” to Enforce the “Consensus”


Tags: Highlighted Article

Temperature “Adjustments” ad Infinitum

The temperature measurements taken to produce the global near-surface temperature anomaly record are “adjusted” for a variety of reasons.  However, the measurements are not “adjusted” once, to achieve a hopefully more accurate value. The graph below, produced by climate4you.com, illustrates the “adjustment” history of calculated temperature anomaly for two specific months in the past, over a period of 10 years, from 2008 to present.

NCDC temperature adjustments

The National Climatic Data Center (NCDC) temperature anomaly value for the month of January 2000 was “adjusted” more than 40 times over the 10-year period from May 2008 to January 2018. While there were both positive and negative “adjustments” made to the calculated temperature anomaly, the net result was an increase of 0.07oC, or more than a 25% increase from the earliest anomaly value shown in the graph.

The NCDC temperature anomaly value for January 1915 was also “adjusted” more than 40 times over the 10-year period from May 2008 to January 2018. Again, there were both positive and negative “adjustments” made to the calculated anomaly. However, in this case, the net result was a decrease of 0.005oC, or only a 4% reduction from the earliest anomaly value shown. It is interesting to note that the calculated anomaly was reduced by as much as 0.065oC during the period, before being increased again in June 2015.

There is no obvious explanation for the apparent need to retrospectively “re-adjust” the temperature anomaly calculations this frequently, or to this extent. The “adjustments” are all in the second decimal place, which means that they are all made at a greater level of “precision” than the underlying measurements.

The graph below illustrates similar retrospective temperature anomaly adjustments made by NASA GISS.

In the January 2000 case, while there are both positive and negative “adjustments”, the net result is again a positive adjustment of 0.07oC. However, in this case, that “adjustment” represents an increase of approximately 40% from the earliest anomaly value shown in the graph. It is important to note that NCDC “adjusts” the temperature measurements before providing them to NASA GISS, which then “re-adjusts” them. The GISS “re-adjustment”, in this case, results in a first anomaly value 0.10oC lower than the anomaly value provided to GISS by NCDC; and, thus, a lower final anomaly value as well.

In the January 1910 case, again there are both positive and negative “adjustments”, but the net result is a negative “adjustment” of 0.17oC. Note that both the January 2000 and the January 1910 values are “re-adjusted” less frequently by NASA GISS than by NCDC.

Both in the case of NCDC and NASA GISS, the net effect of these “re-adjustments” is to increase the temperature anomaly change from the earlier month in 1915 or 1910 to the anomaly in January 2000. In the case of NCDC, the anomaly increase is 0.08oC.  In the case of GISS, the anomaly increase is 0.24oC, or three times the anomaly increase calculated by NCDC. It is also important to note that these changes only reflect the period from 2008 to 2018. There is no corresponding record of “adjustments” made prior to 2008 available from climate4you.com. However, there is little reason to believe that the “adjustments” shown in the graph above were the first “adjustments” made to these anomalies, or that they will be the last.

It is possible that one of the anomaly values shown in each graph line is accurate, but it is certainly not possible that all of the values are accurate; and, it is not certain that any of the values are accurate.


Tags: Temperature Record, Global Temperature, National Climatic Data Center (NCDC), NASA

Highlighted Article: Circular Reasoning In Climate Change Research

By: Jamal Munshi


 Circular Reasoning In Climate Change Research


ABSTRACT: A literature review shows that the circular reasoning fallacy is common in climate change research. It is facilitated by confirmation bias and by activism such that the prior conviction of researchers is subsumed into the methodology. Example research papers on the impact of fossil fuel emissions on tropical cyclones, on sea level rise, and on the carbon cycle demonstrate that the conclusions drawn by researchers about their anthropogenic cause derive from circular reasoning. The validity of the anthropogenic nature of global warming and climate change and that of the effectiveness of proposed measures for climate action may therefore be questioned solely on this basis.

Circular Reasoning In Climate Change Research


Tags: Highlighted Article

Optimum Climate

The instrumental temperature record began with the Central England Temperature (CET) record in the mid-1600s. This period roughly coincides with the nadir of the Little Ice Age (LIA), which extended from approximately 1350 to approximately 1850. The broader instrumental temperature record began in the mid-1800s, roughly corresponding with the end of the LIA. Prior to the instrumental temperature records, all global temperature estimates are based on the analysis of temperature proxies, including tree rings, ice cores, sediments, etc.

The determination of what is the “normal” global average near-surface is frequently tied to the estimated temperature at the end of the LIA (~1850), which is also considered to be the end of the pre-industrial period. This global average near-surface temperature is estimated to be ~57oF (~14oC). This compares to an estimated global average near-surface temperature of ~54oF (~12oC) at the nadir of the LIA. This also compares to a current estimated global average near-surface temperature of ~58.6oF (~15oC), which is similar to the estimated global average near-surface temperature at the peak of the Medieval Warm Period.

The global average near-surface temperature has apparently fluctuated between ~54oF (~12oC) and ~59oF (~15oC) over the past 4500 years. Humanity has found this temperature range congenial, though the warmer periods have been more congenial than the cooler periods, such as the LIA. All of the temperature fluctuations in the first ~4350 years of this period are generally considered to have been the result of natural variation. However, the net positive temperature change over the most recent ~150 years, and especially over the past ~70 years, are frequently attributed, in whole or in part, to human influences, primarily the addition of greenhouse gases to the atmosphere.

It should be noted that the net positive temperature change over the recent ~150-year period has been punctuated by frequent warming and cooling events resulting from continued natural variation. These warming and cooling events have been triggered by El Nino and La Nina events, the Pacific Decadal Oscillation and Atlantic Multi-Decadal Oscillation, as well as by volcanic activity and other non-anthropogenic influences.

UAH Satellite-Based Temperature of the Global Lower Atmosphere

The most dramatic of these natural warming and cooling events was the warming and subsequent cooling associated with the 1997 /1998 El Nino, which produced a temperature spike ~80% of the magnitude of the temperature change since 1850. However, there are numerous other significant natural variations, ranging from ~30% - ~50% of the temperature change since 1850. It is not currently possible to isolate the natural components of these temperature changes from the anthropogenic components.

It should also be noted that the global average near-surface temperature is calculated from a large number of widely varying local and regional near-surface temperatures. For example, the annual average near-surface temperature in Barrow, Alaska is ~17oF, approximately 40oF below the global average; and, in Fairbanks, Alaska the average near-surface temperature is ~37oF, approximately 20oF below the global average. Also, the annual near-surface temperature in Phoenix, Arizona is ~75oF, or approximately 18oF above the global average near-surface temperature.

One issue which is rarely, if ever, raised is the issue of “ideal”, or “optimum” conditions (temperature, precipitation, etc.). Many probably assume that the long-term average global near-surface temperature of ~57oF is the “ideal” temperature, which we should make every effort to maintain. But that raises questions regarding the historical average near-surface temperatures in widely varying locations, such as those noted above. Clearly, if the global average near-surface temperature is “ideal”, then the average temperatures in Fairbanks and Phoenix are non-ideal, as are the temperatures in most of the rest of the globe.


Tags: Global Temperature, Temperature Record, Natural Variability

Climate and the First Amendment

Congress shall make no law respecting an establishment of religion, or prohibiting the free exercise thereof; or abridging the freedom of speech, or of the press; or the right of the people peaceably to assemble, and to petition the Government for a redress of grievances.

The Framers apparently had little concept of the power the Executive Branch and its agencies would develop over time; or, the influence that international bodies would have on the conduct of affairs in the United States. The First Amendment prohibits Congress from making laws, but does not expressly prohibit the Executive Branch from making rules which have essentially the same effect.

The United Nations has effectively established climate change as a form of secular religion globally. Interestingly, this secular religion has been accepted by the leaders of numerous established religions, who support adherence to its beliefs.

The Executive Branch of the US government has essentially established climate change as a form of secular religion in the US. This religion has a system of beliefs which are expected to be accepted without question. These beliefs include: the existence and pre-eminence of anthropogenic climate change; the causes of anthropogenic climate change; the modeled scenarios of potential future climate change; and, the actions required to avoid or mitigate impending climate catastrophe.

Those who question this system of secular religious beliefs are called deniers and treated as heretics. Certain members of Congress, though not the Congress as a body, have attempted to intimidate and silence non-believers, questioning their freedom to speak out in opposition to the climate orthodoxy. Scientists have been removed from positions in the federal government and state governments because they questioned the climate orthodoxy. Other scientists have left the climate change field as the result of harassment.

The current US President is skeptical of the beliefs of this secular religion, as is the current Administrator of US EPA. They are acting to dismantle some of the administrative rules established in support of the climate change religion in the US; and, to reduce or eliminate government funding in support of the climate change religion, including funding to the UN. Their actions are also encouraging skeptics to speak more freely regarding their issues with the climate orthodoxy.

Belief in the modeled scenarios of potential future climate change is currently being called into question on two fronts. First, the modelers have been forced to acknowledge that the models are showing far more rapid warming than is actually occurring, even compared to the “adjusted” temperature anomalies. Also, numerous recent studies have suggested climate sensitivities lower than the sensitivity range used by the climate models.

While the recent science suggests that there might not be an impending climate catastrophe, numerous spokespersons for the UN Framework Convention on Climate Change have recently concluded that the emissions reductions committed to in the Paris Accords are insufficient to achieve the objective of keeping the global temperature anomaly increase below 2oC.

Again, it appears that the “settled science” on which the climate change religion is based might not be as settled as we have been asked to believe.


Tags: Climate Religion, Climate Change Debate

Highlighted Video: Can Climate Models Predict Climate Change?

By: Emeritus Professor of Physics at Princeton University Will Happer

"I’m a physicist.  I taught at Columbia University and then at Princeton for five decades.

I have published over 200 peer-reviewed scientific papers. I have coauthored several books, including one of the first on how carbon dioxide emissions—CO2—affects the climate."

"Predicting climate temperatures isn't science – it's science fiction."


Tags: Highlighted Article

Climate Change Myth - The Crusade to Restore Camelot

The title of this commentary is the subtitle of the paper “Climate and Climate Change” on this site. The lyrics of the song “Camelot”, from the Broadway show of the same name, composed by Alan Jay Lerner and Frederick Loewe, are reproduced below.

ARTHUR:

It's true! It's true! The crown has made it clear.

The climate must be perfect all the year.

A law was made a distant moon ago here:

July and August cannot be too hot.

And there's a legal limit to the snow here

In Camelot.

The winter is forbidden till December

And exits March the second on the dot.

By order, summer lingers through September

In Camelot.

Camelot! Camelot!

I know it sounds a bit bizarre,

But in Camelot, Camelot

That's how conditions are.

The rain may never fall till after sundown.

By eight, the morning fog must disappear.

In short, there's simply not

A more congenial spot

For happily-ever-aftering than here

In Camelot.

Camelot! Camelot!

I know it gives a person pause,

But in Camelot, Camelot

Those are the legal laws.

The snow may never slush upon the hillside.

By nine p.m. the moonlight must appear.

In short, there's simply not

A more congenial spot

For happily-ever-aftering than here

In Camelot.


This song, first performed on Broadway in 1960, could well be the theme song of today’s climate change activists, who wish for and work for a return to some idealized past climate which they found to be, or believed to have been, comfortable and congenial. From their perspective, there should continue to be seasons, but they should occur on a consistent schedule; and, they should not include any extreme weather. There should be no early or late frosts and freezes. There should still be rain and snow, but there should not be too much or too little of either, especially at any given time.

Climate change activists have warned about the end of snow; and, of the end of sea ice and glaciers. They have warned about increasing droughts and floods, increasing and strengthening storms. They have continued these warnings in the face of decreasing storm frequency and intensity. They largely ignored the 12-year hiatus in major hurricane landfalls in the US, but immediately attributed the perceived increased intensity of recent storms to climate change, regardless of the absence of any data to support their contentions.

Certainly, the idealized Camelot never experienced “Snowmageddon”, “Bomb Cyclones”, “Super Storms”, “Polar Vortices”, “Biblical Floods”, “Mega-droughts”, or any of the other newly named events, all of which have occurred previously, without the benefit of their fancy (scary) new names. Climate change activists have extended the naming of storms, such as hurricanes, to snow storms and other events to further call attention to them, even though those events are not unique or even unusual.

There is no equivalent to the mythical Camelot in the real world. Most of the population of the earth lives in climates which bear no significant resemblance to Camelot; and, never have or ever will. Each of these climates has its unique characteristics, though these characteristics are not immutable. Climate change produces variations in the historical characteristics of the weather in these individual climates, but does not introduce new characteristics with no historical precedents.

Much of the adverse impact of severe weather events in any of these climates is the result of human decisions to risk exposure to weather events such as hurricanes and typhoons, tornadoes, monsoons, floods, blizzards, high winds, extreme cold and heat, etc. Other adverse impacts of non-weather events are the result of human decisions to risk exposure to earthquakes, volcanos, tsunamis, etc.

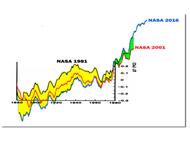
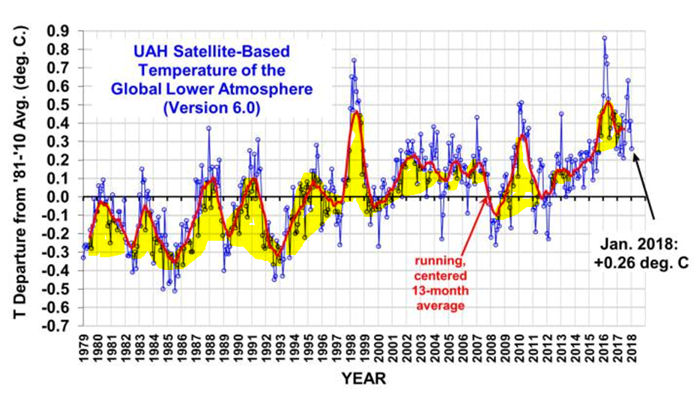
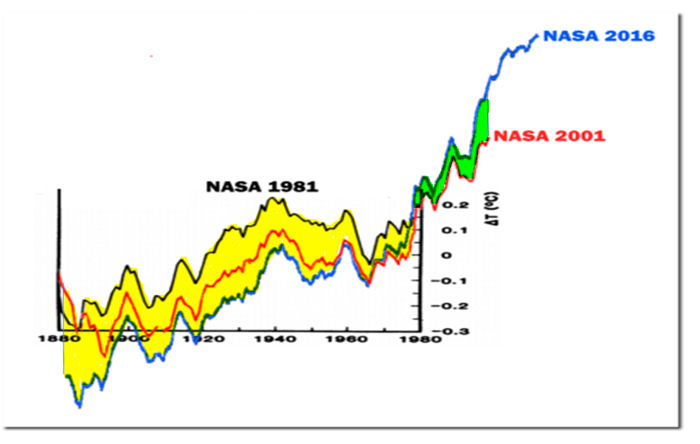
There is no data to support the assertion that any of these weather-related events have been affected, either positively or negatively, by the climate change which has been documented over the period since 1880 for which we have weather and climate data.


Tags: Climate Change Myths

Highlighted Article: Validity of Global Average Surface Temperature Data and CO2 Endangerment Finding

  • Dr. James P. Wallace III
  • Dr. Joseph S. D’Aleo
  • Dr. Craig D. Idso

June 2017

"The conclusive findings of this research are that the three GAST data sets are not a valid representation of reality. In fact, the magnitude of their historical data adjustments, that removed their cyclical temperature patterns, are totally inconsistent with published and credible U.S. and other temperature data. Thus, it is impossible to conclude from the three published GAST data sets that recent years have been the warmest ever –despite current claims of record setting warming. Finally, since GAST data set validity is a necessary condition for EPA’s GHG/CO2 Endangerment Finding, it too is invalidated by these research findings."

On the Validity of NOAA, NASA and Hadley CRU Global Average Surface Temperature Data & The Validity of EPA’s CO2 Endangerment Finding Abridged Research Report


Tags: Highlighted Article
Search Older Blog Posts