The whole aim of practical politics is to keep the populace alarmed (and hence clamorous to be led to safety) by menacing it with an endless series of hobgoblins, all of them imaginary. - H. L. Mencken
The UN and the governments of several nations in western Europe, North America and Australia and the media in those nations have labeled climate change “Code Red”, a “crisis”, an “existential threat” and an “emergency”. They have blamed anthropogenic CO2 emissions for climate change. They have blamed climate change for sea level rise, glacier retreat, heat waves, cold waves, droughts, floods, increased frequency and intensity of tropical cyclones and tornadoes. These assertions are not supported by the IPCC Working Group reports. They are supported, to some extent, by the IPCC Summary for Policymakers, which is a political rather than a scientific document.
These efforts have so far not accomplished the desired alarm among their populations. Recent polls place climate change at or near the bottom of the list of concerns among their populations. Polling indicates that their populations would be interested in or even willing to take various actions to slow climate change, though there is little or no willingness to pay additional taxes or pay more for energy in the process.
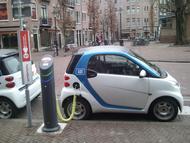
This lack of enthusiastic population response has led governments to take actions which cause inconvenience, pain and suffering for their populations. The US government’s actions intended to limit the supplies of oil and natural gas in the economy have resulted in a doubling of the prices for these commodities. The rapid increase in gasoline prices has stressed people’s budgets but is having the effect of reducing gasoline consumption as people decide to drive less to reduce expenses. The decrease in natural gas availability and the resulting increase in natural gas prices has resulted in an increase in electricity prices as the quantity of gas available in the spot market decreases.
Politics is the art of looking for trouble, finding it everywhere, diagnosing it incorrectly and applying the wrong remedies. - Groucho Marx
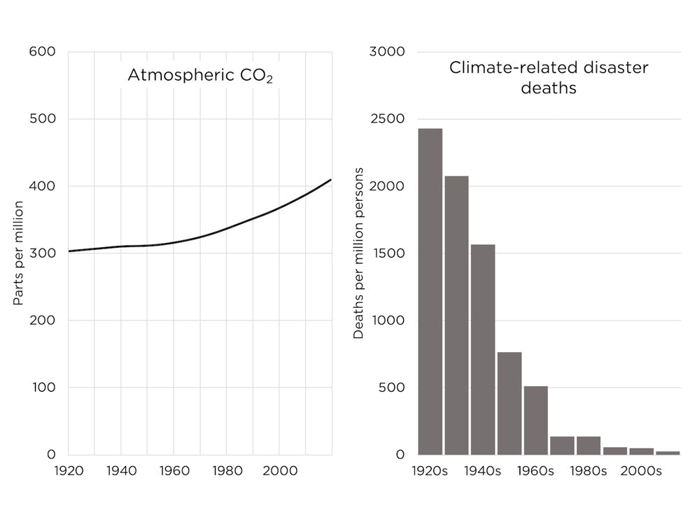
Politicians looking for an issue which would alarm a relatively comfortable and secure populace discovered global warming, then global cooling, then global warming again. This reversal led to a refocus on climate change. They then found climate change everywhere, in sea level rise, glacial retreat, droughts, floods, tropical cyclones and tornadoes. They diagnosed these troubles as resulting from anthropogenic CO2 emissions, though sea level rise and glacial retreat have been occurring at least since the end of the Little Ice Age and droughts, floods, tropical cyclones and tornadoes have been recurring weather events since long before anthropogenic global warming began.
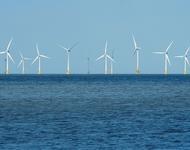
Politicians then decided that the solution to this trouble they found was replacing the use of fossil fuels in their economies with wind and solar electric generation, backed up with electricity storage. In doing so, they chose to ignore the intermittency of these generation technologies and the unavailability of the storage technology required to assure a stable and reliable electric grid. The result has been increased electricity prices and reduced electricity reliability.


 The Right Insight is looking for writers who are qualified in our content areas. Learn More...