One of the potential approaches to dealing with the Irreproducibility Crisis of Modern Science is replication of the experiment. Replication of an experiment is far more expensive than merely attempting to reproduce the results of an experiment by reanalyzing the existing data and the methods used to analyze that data; and, reaching conclusions based upon the data and methods.
Climate science does not offer the opportunity to replicate the “experiment” which is the ongoing, chaotic climate. The fundamental data required to analyze the earth’s weather and ultimately its climate are collected “on-the-fly”, using a variety of different instruments to measure specific aspects of the current conditions. The scientist has no control over the ongoing “experiment”; and, thus, has no ability to replicate the conditions at any prior time to permit replication of data collection or collection of additional data which might improve the analysis. Once this minute, hour, day, week, month or year has passed, it is over, never to be repeated.
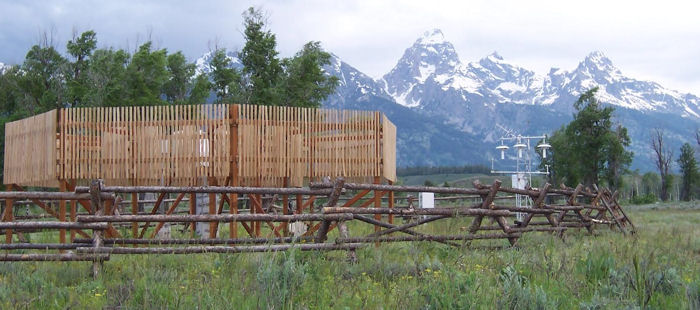
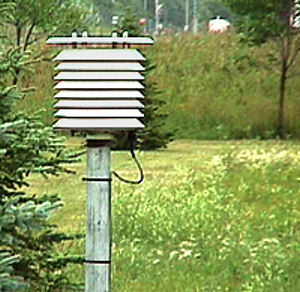
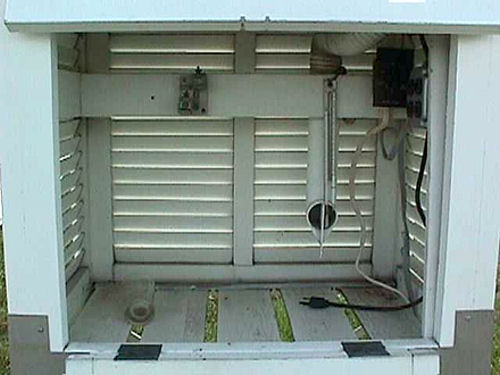
Climate science can improve its ability to analyze the ongoing “experiment” by expanding instrument coverage, utilizing more accurate instruments, deploying multiple sensors at each sensor location to monitor for instrument drift and failure, collecting data more frequently to increase the granularity of the data, etc. The US Climate Reference Network is an example of the deployment of more accurate, multiple sensor monitoring sites with more frequent data collection. The application of satellite-based technology to the measurement of temperatures and sea level is an example of expanding instrument coverage.
However, data which is not collected because there is no instrument deployed, or because an instrument has failed, cannot be replicated. It is forever unavailable. Similarly, data which is inaccurate because of changes in the site metadata or instrument drift is forever inaccurate. Climate science routinely “adjusts” data known or believed to be inaccurate, creating estimates of what the data might have been, had it been collected from properly selected, calibrated, sited, installed and maintained instruments. Some climate science also “infills” missing data, in instances where no sensor has been installed or an installed sensor has failed, again creating estimates of what the data might have been, had it existed. Even if “adjustments” and “infilling” produce accurate estimates, they cannot produce data.
The satellite era has introduced yet another challenge to climate science, which bears aspects of both reproducibility and replication. Satellites are being used to measure atmospheric temperature, sea surface temperature and sea level. The two primary groups analyzing atmospheric temperature, University of Alabama, Huntsville (UAH) and Remote Sensing Systems (RSS) have access to the same data from the same satellites, yet produce results of their analyses which differ from the results produced by the other team. Climate science is currently unable to resolve differences between near-surface and satellite-based temperature measurements. Climate science is also currently unable to resolve the differences between the sea level rise measurements made by surface-based instruments and the contemporaneous measurements made by satellite-based instruments.
The one aspect of climate science which is capable of both reproducibility and replication is exercising of the ensemble of climate models. Climate scientists can analyze the outputs of individual climate model runs and arrive at reproducible conclusions. Climate scientists can also replicate individual model runs using the same inputs and replicate the conclusions. However, that is a trivial result.
Climate science has produced an ensemble of climate models. However, these models, provided the same inputs, will not produce the same results. Therefore, it is not possible that more than one of these models actually models the real climate; and, it is possible that none of the models actually models the real climate. Also, any individual model, provided the range of values of climate sensitivity, forcings and feedbacks, will not produce the same results. Therefore, it is not possible that all of the values of climate sensitivity, forcings and feedbacks are accurate; and, it is possible that none of the values within the ranges are accurate.
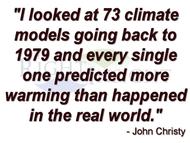
The current ensemble of climate models has not been in use for the 30-year period which defines climate according to the World Meteorological Organization, so it is not yet possible to determine whether any combination of model and model inputs is accurate or has any predictive ability. The best known climate model which has been in use for the 30 year climate period is the model by Dr. James E. Hansen, former Director of NASA GISS, which accompanied his 1988 presentation to the Congress. This model projected future temperatures significantly higher than the temperature observations over the 30 year period.
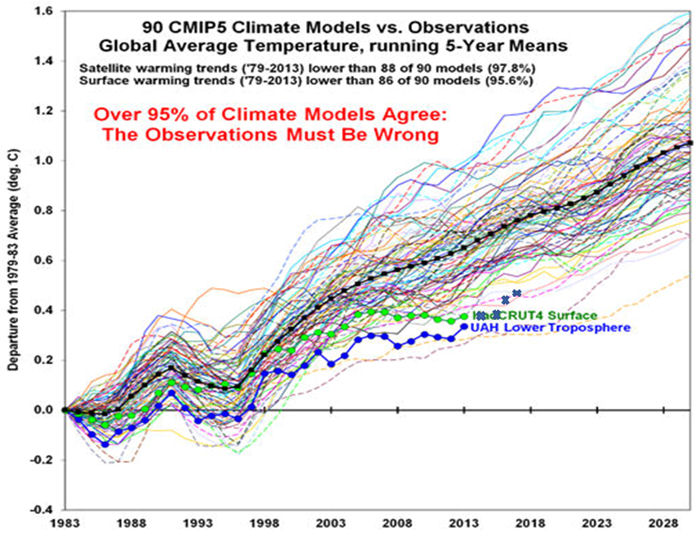
In the shorter term, it has become obvious that the current ensemble of climate models is “running hot”, creating scenarios of potential future warming which are inconsistent with the observations made since the models were run. It does not reflect well upon climate scientists, climate science, or the organizations funding climate studies that these unverified models and their uncertain inputs are being used to produce “scary scenarios” of potential future climate catastrophes. Arguably, the creation of these “scary scenarios” is an exercise in climate research as a self-fulfilling prophesy.
“In the last forty years governments have become interested in universities’ finding academic support for what they are proposing or have in place. We are in an era of ‘policy-based evidence’. We are also in an era of a particular political correctness, where it is very difficult indeed to get funds for research if the purpose of the research seems antithetical to current government policy. ‘Curiosity-directed research’ now comes with some serious barriers.” Don Aitkin, former Chairman of Australia’s National Capital Authority and former Vice-Chancellor and President of the University of Canberra


 The Right Insight is looking for writers who are qualified in our content areas. Learn More...