Call or complete the form to contact us for details and to book directly with us
435-425-3414
435-691-4384
888-854-5871 (Toll-free USA)


Contact Owner

*Name
*Email
Phone
Comment
 
Skip to Primary Navigation Skip to Primary Content Skip to Footer Navigation
▽ Explore More ▽ Hide

Climate and Climate Change

Climate and Climate Change

Climate Change

Two days before Halloween, 2011, New England was struck by a freak winter storm. Heavy snow descended onto trees covered with leaves.  Overloaded branches fell on power lines.  Blue flashes of light in the sky indicated exploding transformers.  Electricity was out for days in some areas and for weeks in others. Damage to property and disruption of lives was widespread.

That disastrous restriction on human energy supplies was produced by Nature.  However, current and future energy curtailments are being forced on the populace by Federal policies in the name of dangerous “climate change/global warming”.  Yet, despite the contradictions between what people are being told and what people have seen and can see about the weather and about the climate, they continue to be effectively steered away from the knowledge of such contradictions to focus on the claimed disaster effects of  “climate change/global warming” (AGW, “Anthropogenic Global Warming”). 

People are seldom told HOW MUCH is the increase of temperatures or that there has been no increase in globally averaged temperature for over 18 years.  They are seldom told how miniscule is that increase compared to swings in daily temperatures. They are seldom told about the dangerous effects of government policies on their supply of “base load” energy — the uninterrupted energy that citizens depend on 24/7 — or about the consequences of forced curtailment of industry-wide energy production with its hindrance of production of their and their family’s food, shelter, and clothing. People are, in essence, kept mostly ignorant about the OTHER SIDE of the AGW debate.

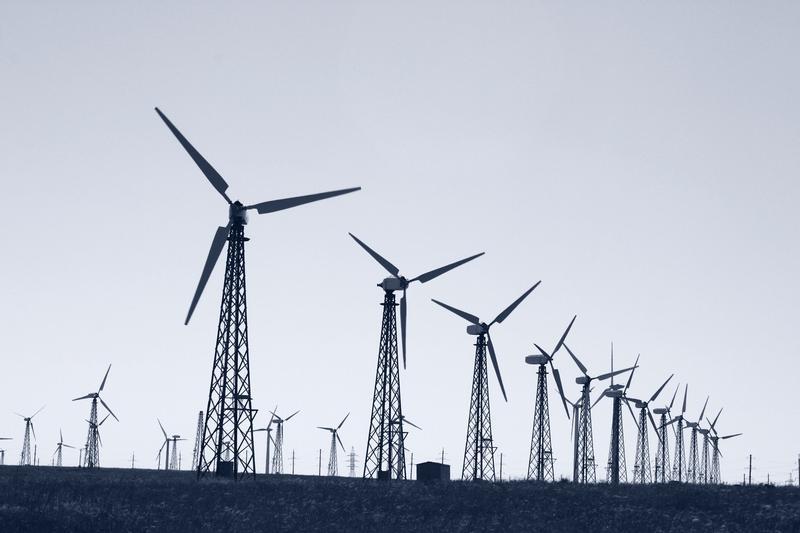
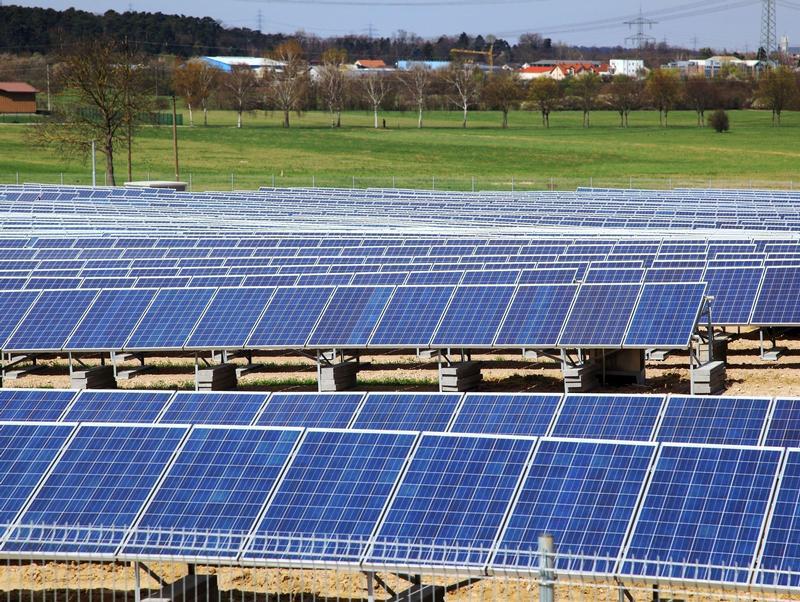
Major scientific organizations — once devoted to the consistent pursuit of understanding the natural world — have compromised their integrity and diverted membership dues in support of some administrators’ AGW agenda.   Schools throughout the United States continue to engage in relentless AGW indoctrination of  students, from kindergarten through university.  Governments worldwide have been appropriating vast sums for “scientific” research, attempting to convince the populace that the use of fossil fuels must be severely curtailed to “save the planet.”  Prominent businesses — in league with various politicians who pour ever more citizen earnings into schemes such as ethanol in gasoline, solar panels, and wind turbines — continue to tilt against imaginary threats of AGW.  And even religious leaders and organizations have joined in to proclaim such threats.   As a consequence, AGW propaganda is proving to be an extraordinary vehicle for the exponential expansion of government power over the lives of its citizens. 

Reasoning is hindered by minds frequently in a state of alarm.  The object of this website is an attempt to promote a reasoned approach; to let people know of issues pertaining to the other side of the AGW issue and the ways in which it conflicts with the widespread side of AGW alarm (AGWA, for short).  In that way it is hoped that all members of society can make informed decisions.

“A Promise Kept: Biden’s War on American Energy” - Highlighted Article

  • 5/5/22 at 07:00 AM


From: Master Resource

By: Robert Bradley Jr.

Date: April 26, 2022


“A Promise Kept: Biden’s War on American Energy”


Some policy statements and summaries are valuable for the historical record. The Republican review below highlighting Biden oil policies relative to gasoline prices is worth studying and memorializing.

Presidential politics and tone are important to the investment health of consumer-driven, taxpayer-neutral energies. Biden campaigned against the very energies the America needs, including those of motorists and other consumers of transportation fuel. Ditto for natural gas. Ditto for coal in the generation of electricity.

It is past time for the oil, gas, and coal industries to wise up and stop trying to appease the radical left. It is past time for Democrats to become the party of the working class. And it is past time for Republicans to become more consistent and forceful against government favors to any energy (ethanol and nuclear included) and any technology (carbon capture and storage) that a business lobby wants. (continue reading)


“A Promise Kept: Biden’s War on American Energy”


Tags: Highlighted Article

Fact or Fancy - ORIGINAL CONTENT

Simple Definition of fact

: something that truly exists or happens
: something that has actual existence
: a true piece of information

Simple Definition of fancy

: to believe mistakenly or without evidence
: to believe without being certain

Source: Merriam-Webster's Learner's Dictionary


I have described climate science as the science of data that aren’t and models that don’t. Climate science is a science of few “facts” and many “fancies”. Much climate “data”, specifically regarding global average temperature anomalies, is not really data because the actual temperature readings have been “adjusted”, for a variety of reasons, and therefore are not “something that truly exists”. Rather, they are estimates of what might have truly existed if the data had been collected timely from properly selected, calibrated, sited, installed and maintained instruments.

It is certainly a “fact” that the globe has warmed since the trough of the Little Ice Age. However, the degree of warming which has occurred is an estimate, because of the non-uniformity of instrument coverage, the “adjustments” made to the instrument readings and changes which have occurred in the immediate surroundings of the instrument locations. Therefore, the reported temperature anomalies are “fancies”, especially considering the precision with which the anomalies are reported.

It is certainly a “fact” that sea level has risen, at a relatively continuous rate since the trough of the Little Ice Age. However, the rate of sea level rise reported from satellite observations is a “fancy” because the measurements have been taken by a series of different satellites using different instruments. The measurements taken by these different satellite instruments do not agree with each other, nor do they agree with the measurements taken by the tide gauges which produced the much longer historical record. The consensed climate science community might believe that the satellite measurements, or at least one set of the satellite measurements, are accurate but they cannot be certain because of the discrepancies.

The outputs of the climate science models are “fancies”, fundamentally because there are multiple models which produce differing results. It is not certain whether any of the model outputs is “a true piece of information”. It is a “fact” that the model outputs have not accurately projected the temperature anomaly estimates developed from the near-surface temperature measurements or from the satellite observations.

The sensitivity of the climate to the addition of ‘greenhouse” gases to the atmosphere is a “fancy”, in that it is expressed as a range of values, which is a clear illustration of uncertainty; and, because there is uncertainty regarding whether the actual sensitivity value lies within the range of values used. Feedback within the atmosphere are also “fancies”, since it is uncertain whether feedback is positive or negative, no less its actual magnitude.
 
Finally, observations of weather events such as hurricanes, tornadoes, floods and droughts are facts. However, attribution of some aspect of the characteristics of these weather events, using unverified and unvalidated models, are “fancies”. There is no clear evidence of a climate change contribution to the characteristics of the weather events, their frequency or their duration.

It has become common to portray climate change “fancies” as “facts”, even in the absence of evidence and certainty. This constitutes an excess of hubris and an absence of humility.


Tags: Climate Change Debate, Climate Science

The State of the Climate 2021 - Highlighted Article

  • 4/28/22 at 07:00 AM


From: The Global Warming Policy Foundation

By: Ole Humlum

Date: April 2022


The State of the Climate 2021


General overview 2021

This report has its main focus on observations and not on the output of numerical models, with the exception of Figure 39 (see p. 38). References and data sources are listed at the end of the report.

Air temperatures

Air temperatures measured near the planet’s surface (surface air temperatures) are at the centre of many climate discussions, but the significance of any short-term warming or cooling should not be overstated. Whenever the Earth experiences warm El Niño or cold La Niña episodes, major heat exchanges take place between the Pacific Ocean and the atmosphere above, eventually showing up as a signal in the global air temperature. However, such heat exchanges may chiefly reflect redistribution of energy between ocean and atmosphere, and not a change in the heat content of the atmosphere–ocean system. Evaluating the dynamics of ocean temperatures is therefore just as important as evaluating changes in surface air temperatures.

Considering surface air temperature records since the 19th century, 2021 was a warm year, but cooler than most years since 2016. A moderate La Niña episode played out during 2021, underlining the importance of ocean–atmosphere exchanges.

Many Arctic regions experienced record high air temperatures in 2016, but since then, including in 2021, conditions have generally moved toward somewhat cooler conditions. The temperature peak in high northern latitudes in 2016 may have been affected by ocean heat released from the Pacific Ocean during the strong 2015–16 El Niño and subsequently transported towards the Arctic region. This underscores how air temperatures may be affected, not only by variations in local conditions, but also by variations playing out in geographically remote regions.

Many figures in this report focus on the period since 1979 – the satellite era – when access to a wide range of observations with nearly global coverage, including temperature, became commonplace. These data provide a detailed view into temperature changes over time at different altitudes in the atmosphere. Among other phenomena, these observations reveal that a Stratospheric temperature plateau has prevailed since 1995.

Since 1979, lower Troposphere temperatures have increased over both land and oceans, but most clearly over the land. The most straightforward explanation for this is that much of the warming is caused by solar insolation, but there may be several secondary reasons, such as changes in cloud cover and land use.

Oceans ... (continue reading)


The State of the Climate 2021


Tags: Highlighted Article

Modeling Challenge - ORIGINAL CONTENT

Modeling has an uncertain reputation in climate science. However, the climate models are the purported underlying cause of the political concern regarding climate change and the “global” efforts to fundamentally change the global energy economy to avoid the “calamity” projected by the climate models.

The proposed changes to the global energy economy include the elimination of the use of fossil fuels as energy sources and their replacement with a combination of renewable energy generation and energy storage.  The proposed “deep decarbonization” would shift all current fossil fuel energy end uses to electric end-use vehicles, appliances and processes. This transition would approximately quadruple the current demand and consumption of electricity in the US economy.

It would be difficult, but extremely useful, to model this transition to determine the types and quantities of renewable generators and storage systems necessary to assure a reliable electric grid which would provide the most economical electric service for this greatly expanded demand and consumption scenario.

Ideally, the model would be national in scope. It would take into account the varying availability of each type of renewable resource in each region of the country, varying regional load patterns and historical regional weather conditions. Such a model would be essential to developing a regional demonstration of a renewable plus storage grid and could be developed initially to support that demonstration and then extended to national scope.

Critical historical weather factors for this model would include solar insolation, wind intensity, duration and timing, seasonal differences in solar and wind availability and the duration of low/no solar and wind periods. This information would be used to calculate the real capacity of the renewable generators under these conditions. It would also be used to calculate the frequency, rate and duration of transfers of electricity to and from storage and the additional generating capacity required to recharge storage under these operating conditions.

The model would initially be subject to significant uncertainty regarding storage, since the long-duration storage required to respond to multi-day and seasonal variations in renewable generator output are not currently available commercially, so their cost and their performance over the expected range of operating conditions are unknown. Experience with 4-hour storage is also quite limited. The range of expected storage operating conditions will also affect the in and out losses attributable to the storage system itself and to the generator DC to storage DC voltage conversion and the storage DC to grid voltage AC inversion.
The model would also be continually subject to uncertainty regarding the rate of growth of overall energy demand and consumption in the economy, as well as the rate of conversion of fossil fuel end-uses to electric end uses and the resulting increase in electricity demand and consumption.

The generation and storage design for the proposed demonstration program would be based on the model of the demonstration zone. Analysis of the data from the proposed demonstration program would permit the model to be adjusted based on the performance of the demonstration zone infrastructure.

The development and testing of this model are far more important than the use of climate models to generate “scary scenarios” of potential future devastation.


Tags: Electric Power Generation, Electric Power Reliability, Energy Storage / Batteries

Where have all the Clouds gone and why care? - Highlighted Article

  • 4/21/22 at 07:00 AM


From: Watts Up With That

By: Charles Blaisdell PhD ChE

Date: April 13, 2022


Where have all the Clouds gone and why care?


The earth’s cloud cover has long been an important puzzle in climate change.  Cloud cover has many types and varies significantly from year to year.  Ground records of global cloud cover over 40 years have shown a 0.41%/decade decrease in cloud cover. (A 37-year European only study found a 1.4%/decade decrease).  In the last 20 years, Dübal and Vahrenholt CERES satellite has data that confirmed the ground observations of cloud cover decrease and a correlation with earth’s net incoming energy flux, albedo, and earth’s temperature rise.  Albedo is derived from the Latin word for white, a high albedo, 1.0, is totally reflective of sun light and a low albedo, 0.0, is totally absorbent, with albedo the lower the hotter.  These few pieces of data beg some questions.   When did cloud cover start to decrease?  Is it cyclic?  How much of the of the observed global warming, GW, can be attributed to cloud cover reduction?  What is causing it?  Will the decrease stop?  And, why should I care?  Let’s start with why should I care, every 1% reduction in cloud cover could account for 1.6 W/m^2 (about 0.8’C) increase in earth’s net incoming energy flux – a significant part of all the observed GW.  If this decrease started a 100 years ago and the current decrease is 0.4%/decade the total decrease over that time could be 2% or 3.2 W/m^2 (estimated 1.6’C GW) – more than the observed 2.2 W/m^2 (1.1’C GW).  Sumerville and Gautier in 1995 summarized that if the cloudiness of the earth decrease it would have a much greater effect on GW than doubling the CO2.  In 1995 no data existed that suggested the cloud cover or relative humidity was changing over time.  That is no longer true. (continue reading)


Where have all the Clouds gone and why care?


Tags: Highlighted Article

Renewable Productivity - ORIGINAL CONTENT

The wind and solar generation systems installed in the US have been installed in the most favorable locations available, for obvious reasons. However, as wind and solar generation are expanded toward a renewable plus storage generation infrastructure and electric demand increases as the result of electrification of transportation, residential, commercial and industrial appliances and equipment, wind and solar installations will have to be extended into less favorable locations.

US EIA Electric Power Monthly reports the annual average capacity factor of US wind installations as 35.3%, with capacity factors ranging from 28.2% - 41.1% seasonally. The annual average solar photovoltaic capacity factor is reported as 24.2%, with capacity factors ranging from 14.9% – 33.3% seasonally. These capacity factors would be expected to decrease somewhat as installations expanded into less favorable locations. However, capacity factors for offshore wind installations are expected to be somewhat higher than for onshore wind, in the range from 40-50%.

Solar installations in the northern tier of the US would be expected to have lower capacity factors during the Winter as the result of the lower sun angle and snow accumulations on the collector surfaces. Wind turbines operating in colder climates would require heating of the blades to avoid snow and ice accumulations, which would impose parasitic power consumption on the turbine generating capacity.

However, the greatest expected impact on renewable generation capacity factors would likely be the need to overbuild generation to have excess capacity available to recharge storage when storage replaces fossil generation as grid support when renewable generation fluctuates and during periods of low/no wind and solar availability. Significant renewable generation capacity would be in surplus during periods of good wind and solar availability when storage is fully charged.

The analysis of the need for storage is somewhat simpler for solar than for wind. On a clear day, solar collectors might generate at rated capacity for as long as 8 hours. However, they will predictably generate no electricity for the remaining 16 hours of the day. Therefore, any loads they serve would have to be served from surplus wind availability or from storage. Some solar generators are installing 4-hour storage to serve the daily peak in the late afternoon, after the solar system stops generating. However, that storage capacity must be recharged from excess capacity during the 8-hour solar generating day.

Wind generation is less predictable throughout the day and its fluctuations and interruptions must be met from storage, which must also be recharged from excess capacity during the day.

The increased investment resulting from generation overbuilding and the requirement to provide short and intermediate duration storage to smooth fluctuations in renewable generation output and long-duration storage to support the grid during periods of low/no wind and solar availability will also substantially increase the cost of the renewable plus storage grid. However, these additional costs are unavoidable if the grid is to be stable and reliable and not subject to catastrophic failure. Renewable generation developers have been able to ignore these issues in the mixed renewable and fossil grid, but will be unable to do so going forward.


Tags: Backup Power, Renewable Energy, Energy Storage / Batteries

REJECT AR6 - Highlighted Article

  • 4/14/22 at 07:00 AM


From: Ventura Photonics

By: Roy Clark

Date: February 20, 2022


REJECT AR6


The Sixth IPCC Climate Assessment Report (AR6) should be rejected outright because it is based on the use of fraudulent climate models. This fraud comes from the underlying assumption of radiative forcing in an equilibrium climate used to construct the models. Such models are fraudulent by definition, before a single line of computer code is written. Climate science has now degenerated past scientific dogma into the quasi-religious ‘Imperial Cult of the Global Warming Apocalypse’. Scientific reason has been replaced by blind advocacy. There is no ‘climate crisis’. Eisenhower’s warning about the corruption of science by government funding has come true. The entire multi-trillion dollar Ponzi or pyramid scheme built on these fraudulent modeling results needs to be shut down and those responsible should face the legal consequences of their activities.


SUMMARY

The recently published draft of the latest UN Intergovernmental Panel on Climate Change (IPCC) Report, Climate Change 2021: The Physical Science Basis, [IPCC, 2021] the contribution of Working Group 1 to the Sixth IPCC Climate Assessment (AR6) should be rejected outright because the report is based on the results from fraudulent climate models. This fraud comes from the underlying assumption of radiative forcing in an equilibrium average climate used to construct the climate models. These models are fraudulent by definition before any computer code is even written. AR6 is a continuation of the climate modeling fraud that started with the invalid assumptions that were made when the first computer climate models were developed in the 1960s. All of the equilibrium climate model results used by the IPCC since it was established in 1988 are fraudulent.

There are at least three separate parts to this fraud. First there are the invalid climate equilibrium and related assumptions that originated in the nineteenth century. These led to melodramatic prophecies of the global warming apocalypse and became such a good source of research funding that the scientific process of hypothesis and discovery collapsed. Second, there was institutional fraud related to ‘mission creep’ within various government agencies. For example, NASA was established to put a man on the moon. There was no provision to shut it down after that mission was accomplished. Climate modeling provided alternative employment for some of the NASA ‘scientists’ with nothing else to do. The climate fraud was firmly established at NASA by 1981. Third, there was a deliberate decision by various outside interests, including environmentalists and politicians to exploit the climate apocalypse to further their own causes. There was no single person or event that created the climate fraud. There was a gradual transition from the invalid hypothesis of an equilibrium average climate to the massive multi-trillion dollar pyramid or Ponzi scheme that we have today. (continue reading)


REJECT AR6


Tags: Highlighted Article

Grid Balancing - ORIGINAL CONTENT

The electric utility grid requires instantaneous balancing of demand and supply. Historically, most fluctuations on the grid were the result of changes in customer demand. However, as intermittent renewable sources of generation are added to the grid, changes in the output of wind and solar generation sources increase the complexity of grid balancing. A recent report by Elexon regarding grid balancing in the UK illustrates the rapid increase of grid balancing costs as the intermittent renewable fraction of generation increases. The report suggests that this trend will continue as the percentage of intermittent generation on the grid increases.

The principal source of grid balancing generation in the UK is natural gas combined-cycle generators, as it is in the US. Battery storage is currently a minor source, though it is planned to grow considerably. However, it is critical that battery storage growth exceeds the rate of reduction of capacity of the other sources of grid balancing generation, particularly natural gas generation. This is especially important because of the anticipated growth of electric demand resulting from the electrification of transportation, residential, commercial and industrial energy consumption.

As the transition from fossil generation to renewable generation proceeds, the contemporaneous transition from fossil grid balancing to storage grid balancing would increase the renewable generation capacity required to support the grid. Storage would support the grid during periods of low/no wind and solar generation, but would require the availability of renewable generating capacity in excess of the contemporaneous grid demand to recharge the storage batteries so that they are ready for the next requirement for grid balancing.

The excess generating capacity required would be a function of the duration of the grid balancing demand on storage resources and the period over which storage must be recharged. For example, the “wind drought” which affected the UK and parts of Europe in the fall of 2021 lasted for approximately 10 days. In that case, the grid balancing was accomplished with fossil generation in the UK and nuclear-generated electricity imported from France. However, in a renewable plus storage grid, the balancing generation previously provided by fossil generation would have to be replaced by withdrawals from storage. A requirement to replace the electricity drawn from storage in such a 10-day period over the following 10 days would require a doubling of renewable generating capacity, half to serve the contemporaneous demand of the grid and the other half to recharge storage, assuming no further demands on storage for grid balancing over that period.

It has been common in the US grid to maintain a 20% capacity reserve margin relative to peak demand, should one or more generators need to be taken offline for maintenance or repairs. In a renewables plus storage grid, both the renewable generation and the storage system would have to include such a capacity reserve margin. A requirement to function through a 10-day period of low/no wind and solar and to recharge storage over the succeeding 10-day period, with a 20% capacity reserve margin, would require renewable generating capacity approximately 2.4 times peak demand on the grid.


Tags: Backup Power, Renewable Energy, Energy Storage / Batteries

34 Years of Flawed, Failed & Grossly Misrepresented Global Sea Level Rise Speculation - Highlighted Article

  • 4/7/22 at 07:00 AM


From: Watts Up With That

By: Larry Hamlin

Date: March 29, 2022


34 Years of Flawed, Failed & Grossly Misrepresented Global Sea Level Rise Speculation


For decades climate alarmists in the UK, EU and U.S. have been making flawed and failed exaggerated claims regarding accelerating global level sea level rise being caused by increasing man made CO2 emissions as one means of politically bullying the world’s nations into mandating immensely costly, bureaucratically onerous and completely ineffective global CO2 reductions from these nations.

The flawed CO2 reduction schemes in the EU and UK have created significant declines in energy availability and reliability because of these nations excessive reliance on unreliable, nondispatchable, backup power reliant and costly renewable energy. These politically contrived emissions and energy incompetent policies have resulted in greatly increasing energy costs for EU and UK nations that negatively impacted their economies while significantly increasing their dependence on energy from other nations.

This energy dependence includes greatly increased needs for natural gas, petroleum and coal supplies obtained through other nations and especially from Russia which (before sanctions) provided about 40% of the EU’s natural gas energy as well as being the EUs main supplier of crude oil (27%) and hard coal (49%). This data and other information concerning the EU and UK self-inflicted climate alarmist driven energy and economic debacle is addressed here, here and here.

The EUs efforts to build additional liquified natural gas terminals to wean itself off Russian gas is estimated to take at least three years with existing available import shipping facilities already maxed out. Renewables would take even longer. Any new LNG cargoes will have higher costs than the existing Russian pipelines. EU policy makers are stuck with politically damaging options including rationing energy and using more coal which means dumping climate goals. When push comes to shove emission reductions will take second place to economic survival with this huge energy and emissions policy turnaround already underway and being led by Germany. (continue reading)


34 Years of Flawed, Failed & Grossly Misrepresented Global Sea Level Rise Speculation


Tags: Highlighted Article

Demonstration Reporting - ORIGINAL CONTENT

This commentary suggests a reporting format for the renewable plus storage demonstration discussed in the prior two commentaries.


Pre-demonstration electricity generation infrastructure:


Fuel

Rated Capacity (MW)

Capacity Factor (%)

Annual Generation (MWH)


Coal


Natural gas (CCT)


Natural gas (SCT)


Nuclear


Other


Total


Peak Demand:


Capacity Reserve Margin:


Initial demonstration electricity generation infrastructure:


Source

Rated Capacity (MW)

Capacity Factor (%)

Annual Generation (MWH)


Wind


Solar


Nuclear


Other


Total


Design Peak Demand:


Design Capacity Reserve Margin:


Initial demonstration electricity storage infrastructure:


Storage

Rated Capacity (MWH)

Rated Discharge (MW)


Short Duration


Intermediate Duration


Long Duration


Total


Demonstration electricity demand growth (MW):


Demonstration electricity consumption growth (MWH):


Initial demonstration electricity storage infrastructure:


Source

Rated Capacity (MW)

Capacity Factor (%)

Annual Generation (MWH)


Wind


Solar


Total


Demonstration electricity storage infrastructure additions:


Storage

Rated Capacity (MWH)

Rated Discharge (MW)


Short Duration


Intermediate Duration


Long Duration


Total


Demonstration annual withdrawals from storage:


Storage

(MW)


Short Duration


Intermediate Duration


Long Duration


Total


Demonstration emergency capacity requirements:


Total events (#)


Peak emergency demand (MW)


Total emergency consumption (MWH)


Pre-demonstration customer electricity bills ($/MWH):


Demonstration customer electricity bills ($/MWH)(inflation adjusted):


This proposed demonstration project has several important objectives:

  • Create a unique renewable plus storage service area
  • Force design of a standalone capable renewable plus storage grid
  • Highlight the critical nature of electricity storage in this grid
  • Highlight the evolving status of grid storage technology
  • Highlight the sensitivity of this grid to daily and seasonal weather variations
  • Document in and out storage losses in real storage systems
  • Document inversion system losses in real grid operation
  • Demonstrate the advantages of storage at the generation sites
  • Establish the real cost of electricity in a renewable plus storage grid
  • Document the number and magnitude of grid emergencies
  • Document the effects of the transition to electric vehicles on the grid
  • Document the effects of the transition to electric appliances and equipment
  • Document the effects of the transition to electric industrial processes

The information collected using the form above should be available to the general public on a website designed to provide easily understandable access to information on the performance of the renewable plus storage grid demonstration, since this is the intended future national electric grid. The project should be treated as a learning experience for grid designers and operators, but also for customers served by the grid.

It is regrettable that the demonstration must begin with largely pseudo-storage, rather than physical storage systems. However, it is not possible to design and operate a reliable grid based on renewable generation without storage. The proliferation of renewable generation with conventional generation support has created the impression that renewable generation system design can be simple and inexpensive. However, in a fossil-free generation system, additional renewable generation plus storage must replace the conventional backup currently relied upon for generation when wind and solar generated electricity is not available in sufficient quantities to meet the contemporaneous demand of the electric grid.


Tags: Backup Power, Renewable Energy, Energy Storage / Batteries

A ‘Plan B’ for addressing climate change and the energy transition - Highlighted Article

  • 3/31/22 at 07:00 AM


From: Climate Etc.

By: Judith Curry

Date: March 17, 2022


A ‘Plan B’ for addressing climate change and the energy transition


I have a new article published in the latest issue of International Affairs Forum.

The topic of this issue is Climate Change and Energy.  Mine is one of twenty papers.  A range of topics are covered.  My article is the least alarmed among them.  You may recognize several of the authors, which include Don Wuebbles and Bill McKibben.

Here is the text of my article:

A ‘Plan B’ for addressing climate change and the energy transition

Climate change is increasingly being referred to as a crisis, emergency, existential threat and most recently as ‘code red.’  Climate change has become a grand narrative in which manmade global warming is regarded as the dominant cause of societal problems. Everything that goes wrong reinforces the conviction that that there is only one thing we can do prevent societal problems – stop burning fossil fuels. This grand narrative leads us to think that if we urgently stop burning fossil fuels, then these other problems would also be solved. This sense of urgency narrows the viewpoints and policy options that we are willing to consider in dealing not only with our energy and transportation systems, but also regarding complex issues such as public health, water resources, weather disasters and national security.

So, exactly what is wrong with this grand narrative of climate change?  In a nutshell, we’ve vastly oversimplified both the problem of climate change and its solutions.  The complexity, uncertainty, and ambiguity of the existing knowledge about climate change is being kept away from the policy and public debates.  The dangers of manmade climate change have been confounded with natural weather and climate variability. The solutions that have been proposed for rapidly eliminating fossil fuels are technologically and politically infeasible on a global scale. (continue reading)


A ‘Plan B’ for addressing climate change and the energy transition


Tags: Highlighted Article

Transparency - ORIGINAL CONTENT

I believe that the demonstration project described in the previous commentary should be conducted rigorously and transparently, with broad website access to hourly, daily, monthly and annual data.

The first step in this process would be detailed documentation of the generation resources serving the demonstration zone by type, capacity and capacity utilization over a historical reference period. This information would provide the basis for the design of the renewable plus storage system.

The next step in the process would be the initial design of the renewable plus storage system to replace the existing conventional, dispatchable fossil generation resources. This would include designation of the types and capacities of the wind and solar generators, plus designation of the capacities and delivery rates of short, intermediate and long duration storage to be installed or simulated by pseudo-storage.

The demonstration would commence once the solar and wind generators and any actual storage capacity had been installed and tested. The new wind and solar generators plus the existing non-fossil generation would be used to meet the contemporaneous demand of the grid and to charge both actual and pseudo-storage.

The demonstration website would report the quantity of electricity generated by each type of generation both in absolute terms and as a percentage of rated capacity, as well as the electricity in both actual and pseudo-storage and its deliverability.

Failure to satisfy contemporaneous grid demand with the demonstration zone resources would be compensated for by measured deliveries from conventional fossil resources, but would require immediate determination of the renewable generation resources and/or storage resources required to avoid such emergencies in the future, and the costs of acquisition and installation of those resources.

Transparency would also require that all renewable generation and storage resources installed in the demonstration zone be capitalized at their full cost, with no federal or state incentives of any kind. The full costs of land acquisition, site preparation and facilities installation would also be included. Actual storage facility costs would be documented and pseudo-storage costs would be set equal to wind and solar generator costs for systems with equivalent delivery capacity times the number of days of capacity stored. Such calculated costs would be replaced with real facility costs when real storage equipment becomes commercially available. This approach would assure that customers in the demonstration zone pay the real costs of the electricity they consume.

All emergency generation and pseudo-storage electricity deliveries would be priced at the full cost of providing the service on an emergency basis. This pricing could be negotiated between the demonstration zone management and the utilities positioned to provide the service. These costs should be based on the cost of the next increment(s) of generation for the supplying utilities, since this is the electricity which would have to be generated over and above the supplying utility’s contemporaneous grid demand.

These approaches to the demonstration should assure that the demonstration zone facilities would be designed to be a reliable and flexible renewable electric system and that the electricity costs in the demonstration zone would representative of a renewable plus storage grid on a national scale.


Tags: Energy Storage / Batteries, Renewable Energy, Backup Power
Search Older Blog Posts