
Climate Change

Two days before Halloween, 2011, New England was struck by a freak winter storm. Heavy snow descended onto trees covered with leaves. Overloaded branches fell on power lines. Blue flashes of light in the sky indicated exploding transformers. Electricity was out for days in some areas and for weeks in others. Damage to property and disruption of lives was widespread.
That disastrous restriction on human energy supplies was produced by Nature. However, current and future energy curtailments are being forced on the populace by Federal policies in the name of dangerous “climate change/global warming”. Yet, despite the contradictions between what people are being told and what people have seen and can see about the weather and about the climate, they continue to be effectively steered away from the knowledge of such contradictions to focus on the claimed disaster effects of “climate change/global warming” (AGW, “Anthropogenic Global Warming”).
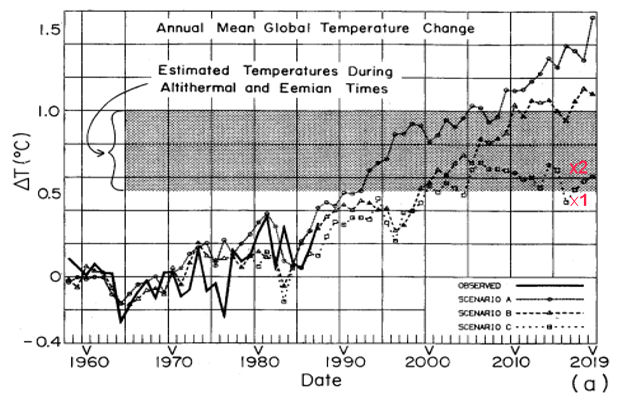
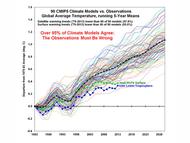
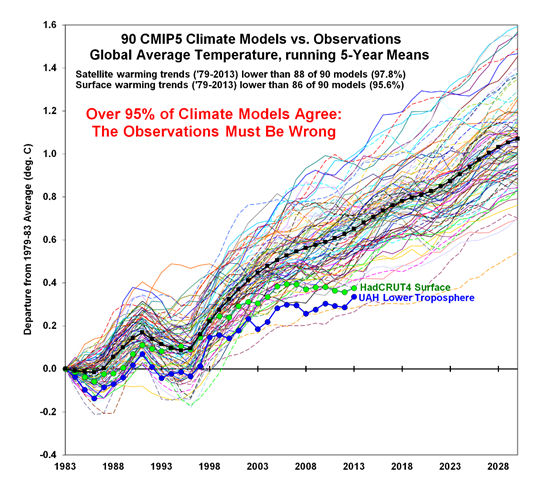
People are seldom told HOW MUCH is the increase of temperatures or that there has been no increase in globally averaged temperature for over 18 years. They are seldom told how miniscule is that increase compared to swings in daily temperatures. They are seldom told about the dangerous effects of government policies on their supply of “base load” energy — the uninterrupted energy that citizens depend on 24/7 — or about the consequences of forced curtailment of industry-wide energy production with its hindrance of production of their and their family’s food, shelter, and clothing. People are, in essence, kept mostly ignorant about the OTHER SIDE of the AGW debate.
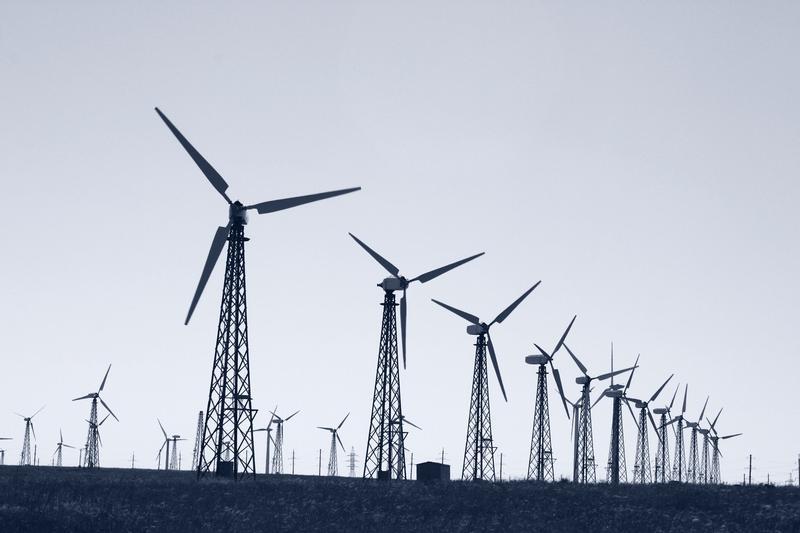
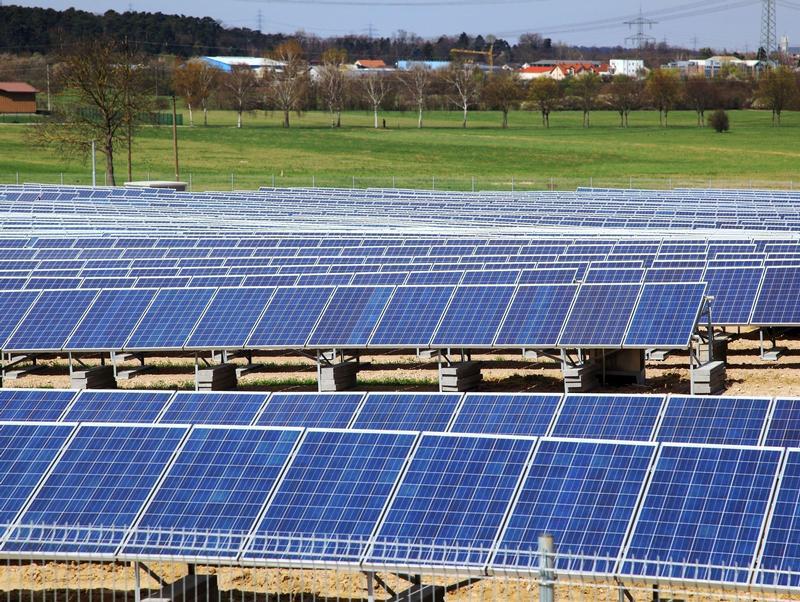
Major scientific organizations — once devoted to the consistent pursuit of understanding the natural world — have compromised their integrity and diverted membership dues in support of some administrators’ AGW agenda. Schools throughout the United States continue to engage in relentless AGW indoctrination of students, from kindergarten through university. Governments worldwide have been appropriating vast sums for “scientific” research, attempting to convince the populace that the use of fossil fuels must be severely curtailed to “save the planet.” Prominent businesses — in league with various politicians who pour ever more citizen earnings into schemes such as ethanol in gasoline, solar panels, and wind turbines — continue to tilt against imaginary threats of AGW. And even religious leaders and organizations have joined in to proclaim such threats. As a consequence, AGW propaganda is proving to be an extraordinary vehicle for the exponential expansion of government power over the lives of its citizens.
Reasoning is hindered by minds frequently in a state of alarm. The object of this website is an attempt to promote a reasoned approach; to let people know of issues pertaining to the other side of the AGW issue and the ways in which it conflicts with the widespread side of AGW alarm (AGWA, for short). In that way it is hoped that all members of society can make informed decisions.
Climate Change News
Ground Rules for a Red Team / Blue Team Climate Debate
- 9/26/17 at 06:15 AM

Hansen Revisited – Were the Climate Models Right?
- 9/19/17 at 07:33 AM
Who Stole My Warming – Problems With the Models
- 9/12/17 at 06:32 AM
Cost / Benefit Analysis in the Regulatory Process
- 9/5/17 at 06:15 AM
“It’s the Law of the Land” – UN Agencies Recognizing the Palestinian Authority
- 8/29/17 at 06:33 AM
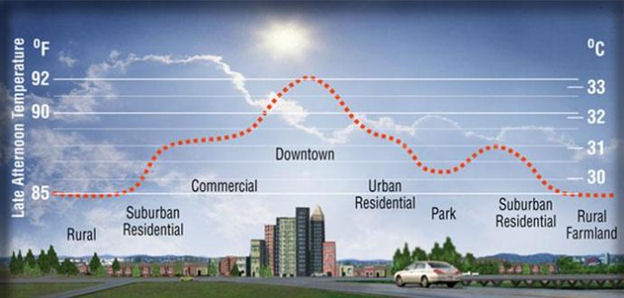
Urban Heat Island Effect
- 8/22/17 at 06:23 AM

Chinese Climate Leadership
- 8/15/17 at 06:52 AM

Virtue Signaling When Responding to Climate Polls
- 8/8/17 at 09:49 AM

Climate Linguistics
- 8/1/17 at 08:08 AM

Climate Research Priorities
- 7/25/17 at 07:01 AM
Green Climate Funding
- 7/18/17 at 05:58 AM
Paris Paranoia – The results of the U.S. withdrawal from the Paris Climate Agreement
- 7/11/17 at 06:48 AM

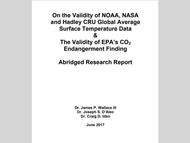
Highlighted Article: On the Validity of NOAA, NASA and Hadley CRU Global Average Surface Temperature Data & The Validity of EPA’s CO2 Endangerment Finding
- 7/7/17 at 10:43 AM
EXTRA - Some Thoughts on Independence Day 2017
- 7/5/17 at 09:03 AM

The Paris Climate Agreement
- 7/4/17 at 07:23 AM

-
Headlines
Search Headlines-
Residential Solar -The Issues
- Kilovar's Substack
- August 24, 2025
-
Stop These Things’ Weekly Round Up: 24 August 2025
- Stop These Things
- August 24, 2025
-
Pragmatic Environmentalist of New York Summary Update August 11, 2025 – August 24, 2025
- Roger's Substack
- August 24, 2025
-
"Saving the Planet" - Chronicles of Climate Chutzpah, Issue No. 83
- Energy Security and Freedom - Substack
- August 24, 2025
-
Green Jobs Make Us Poorer
- Eigen Values - Substack
- August 23, 2025
-
Net Zero Rebellion Growing in Australia
- Watts Up With That
- August 23, 2025
-
Poor Solar Energy Performance is More Evidence the VCEA is Failing
- Thomas Jefferson Institute For Public Policy
- August 22, 2025
-
A Rare Earth Mine Opens in Wyoming
- IER
- August 22, 2025
-
EXCLUSIVE: Trump Admin Kills Massive Offshore Wind Project
- Daily Caller
- August 22, 2025
-
Pacifico Energy unveils 5GW offgrid natural gas project in Texas slated to serve a hyperscale data center
- Data Center Dynamics
- August 21, 2025
-
-
Scholars Wanted
 The Right Insight is looking for writers who are qualified in our content areas.
